

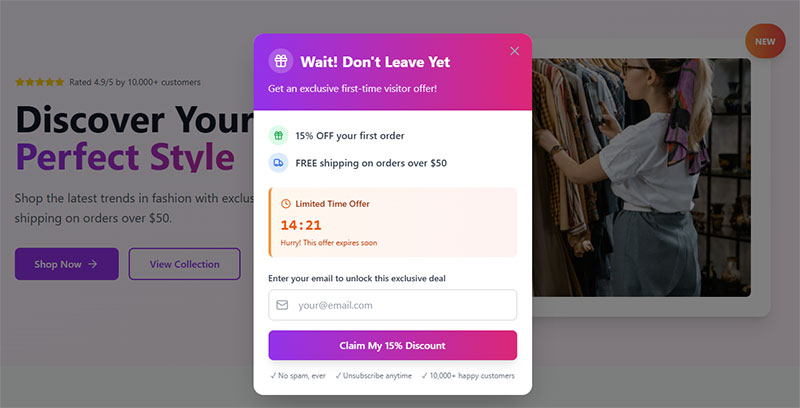
Most lead magnets don’t work. They get downloaded, skimmed for 30 seconds, and forgotten. Meanwhile, your email list fills up with people who will never buy anything. The problem isn’t…
Table of Contents
Forms convert. Or they don’t.
The difference between a high-performing B2B website and one that bleeds prospects often comes down to how well you generate B2B leads using website forms.
Most companies slap a generic contact form on their site and hope for the best. That approach leaves serious money on the table.
This guide covers everything from form field optimization and strategic placement to lead qualification questions and CRM integration with platforms like HubSpot and Salesforce.
You’ll learn what separates forms that convert at 2% from those hitting 12%, and how to build a lead capture system that actually fills your sales pipeline with qualified prospects.
What is B2B Lead Generation with Website Forms
B2B lead generation with website forms is the process of collecting business contact information through structured online forms placed on your website.
These forms capture visitor details like name, email, company name, job title, and specific business needs.
The collected data feeds directly into your sales pipeline through CRM integration with platforms like HubSpot, Salesforce, or Pipedrive.
Website forms serve as the primary conversion point where anonymous traffic becomes identifiable prospects.
They work across landing pages, your contact us page, content downloads, and demo request pages.
Unlike B2C transactions, B2B lead capture requires qualifying information that helps sales teams prioritize outreach and personalize follow-up sequences.
How Do Website Forms Generate B2B Leads
What Information Do B2B Lead Forms Collect
B2B lead generation forms collect varying data depending on funnel stage and qualification needs.
Basic fields:
- First and last name
- Business email address
- Company name
Qualifying fields:
- Job title or role
- Company size (employee count)
- Industry vertical
- Annual revenue range
- Budget availability
- Project timeline
Intent-based fields:
- Specific pain points
- Product interest areas
- Preferred contact method
The form fields you choose for capturing high-quality leads directly impact both conversion rates and lead quality.
Where Should B2B Lead Forms Be Placed
Strategic placement affects both conversion rates and lead quality.
High-performing locations include:
- Landing page forms with dedicated value propositions
- Blog content with relevant gated content offers
- Pricing pages with quote request options
- Homepage with prominent contact sections
- Exit-intent forms for leaving visitors
- Sidebar widgets on high-traffic pages
Above-the-fold placement typically outperforms below-fold positioning.
Longer sales pages may benefit from forms placed after value demonstration.
What Types of B2B Lead Forms Exist
Different types of forms serve different stages of the B2B buyer journey.
Contact forms collect general inquiries and route them to sales teams.
Demo request forms qualify high-intent prospects seeking product demonstrations.
Content download forms gate valuable resources like whitepapers, ebooks, and research reports.
Quote request forms capture pricing inquiries with project-specific details.
Subscription forms build email lists for ongoing nurture campaigns.
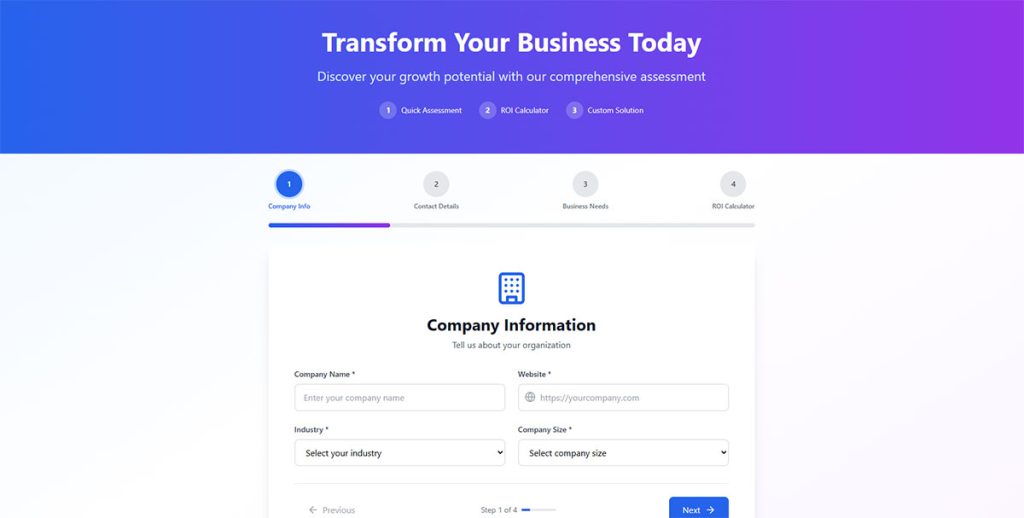
Multi-step forms break long questionnaires into digestible sections with progress indicators.
Quiz-style forms engage visitors while collecting qualifying information through interactive questions. You can explore using quizzes for higher engagement rates.
How to Create High-Converting B2B Lead Forms
How Many Form Fields Should B2B Forms Include
HubSpot’s 2024 study shows each additional form field decreases conversion by 4.1% on average. The numbers are stark.
Field count by funnel stage:
- Top-of-funnel (newsletter, content): 2-3 fields
- Mid-funnel (webinar, consultation): 4-5 fields
- Bottom-of-funnel (demo, quote): 5-7 fields
Reducing fields from four to three can boost conversions by 50%, according to Quicksprout research.
Phone numbers kill submissions. WPForms data reveals 37% of users abandon forms that require phone numbers. Switch phone fields to optional and watch abandonment drop from 39% to 4%.
Forms with 5+ fields see conversion rates plummet 30% compared to shorter variants, MarketingSherpa Research Institute found in 2024.
Action steps:
Start with 3 fields (name, email, company). Test adding one field at a time. Track where drop-offs spike. Cut fields that don’t qualify leads.
Consider whether you need to choose between multi-step forms or single-step forms based on data requirements.
What Makes a Strong Form Value Proposition
Your lead magnet determines whether visitors submit.
Research from Formstack shows 67.8% abandonment rates when forms request 7+ fields without clear value.
Value proposition framework:
- Specific outcome (not generic benefits)
- Quantified results (numbers, percentages)
- Time investment (how long to consume)
- Immediate access (no waiting)
“Download the 47-page guide that helped 200+ SaaS companies increase demo bookings by 35%” beats “Download our ebook” every time.
B2B Magazine reports 59% of B2B marketers rank email as their top revenue channel. Your value prop needs to justify the exchange.
Implementation:
Write 5 variations. Test each for one week. Measure completion rates. Pick the winner. Repeat monthly.
How Should Form Fields Be Sequenced
Field order drives completion rates. Zuko Analytics data shows name fields take 3.5 seconds to complete with just 0.3 field returns. Phone numbers? Users abandon at 6.3% rates.
Proven sequence:
- Low-friction first (name, email)
- Qualifying middle (company, job title)
- Sensitive last (budget, phone, timeline)
This builds micro-commitments. Each completed field pushes users toward submission.
CXL research found inline form-field validation cuts errors 22% and completion time 42%. Show errors immediately, not after submission.
Marketing automation platforms like Marketo and Eloqua enable smart sequencing that adapts to known visitor data.
Quick wins:
Move phone to bottom. Add inline validation. Pre-fill known data. Test radio buttons vs. dropdowns (radio buttons save 2.5 seconds per field, according to CXL).
What Call-to-Action Copy Works Best
“Submit” reduces conversions by 3% compared to action-oriented alternatives, according to Insiteful research.
Sender.net’s 2025 analysis shows first-person phrasing (“Start My Free Trial”) boosts clicks 90% over second-person (“Start Your Free Trial”).
High-converting CTA examples:
- “Get Your Free Audit”
- “Schedule My Demo”
- “Download the Report”
- “Start My Free Trial”
WordStream data reveals personalized CTAs convert 202% better than generic ones. HubSpot analyzed 330,000 CTAs and confirmed the same pattern.
One case study shifted a single word and qualified homepage leads jumped 221%.
CTA optimization checklist:
Use action verbs (get, start, download, schedule). Make it first-person. Add specific value. Test weekly. Track qualified leads, not just submissions.
Focus on increasing form conversions through continuous testing.
Performance benchmarks:
- Average B2B landing page conversion: 2.9% (Ruler Analytics, 2025)
- B2B SaaS average: 1.1% (First Page Sage, 2025)
- Top 10% convert at: 11.5%+ (WordStream, 2025)
Track your forms against these. If you’re below industry average, start with field count and CTA copy.
How to Improve B2B Form Conversion Rates
B2B landing pages convert at 1.1% on average, according to First Page Sage’s 2025 analysis. Top performers hit 2-3%, showing massive room for improvement.
The median form completion rate sits at 66% across industries, per Zuko Analytics data. That means one-third of people who start your form abandon it.
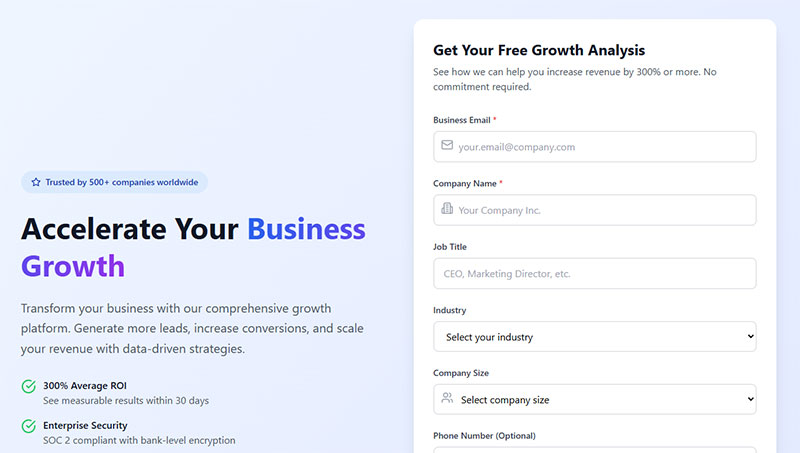
What Design Elements Increase Form Conversions
Single-column layouts outperform multi-column designs.
Research from CXL shows users complete single-column forms 15.4 seconds faster than multi-column versions. That speed difference translates to fewer abandonments.
Key form design principles:
- Keep forms to 5 fields or fewer (forms with 5 fields convert 120% better than longer ones, per Cobloom)
- Place labels above inputs, not inside as placeholder text
- Use white space to reduce cognitive load
- Display branded elements to build recognition
Inline validation delivers measurable impact.
Data from CXL demonstrates that inline form-field validation causes a 22% decrease in errors and cuts completion time by 42%. Users get immediate feedback on mistakes instead of failing at submission.
Good form UX design ensures mobile and desktop usability.
Form accessibility expands your potential lead pool to include prospects using screen readers.
Implementation checklist:
| Element | Action | Expected Impact |
|---|---|---|
| Layout | Switch to single column | 15.4 seconds faster completion |
| Field count | Reduce to 5 or fewer | Up to 120% conversion lift |
| Validation | Add inline feedback | 22% fewer errors |
| Labels | Move above fields | Higher completion rates |
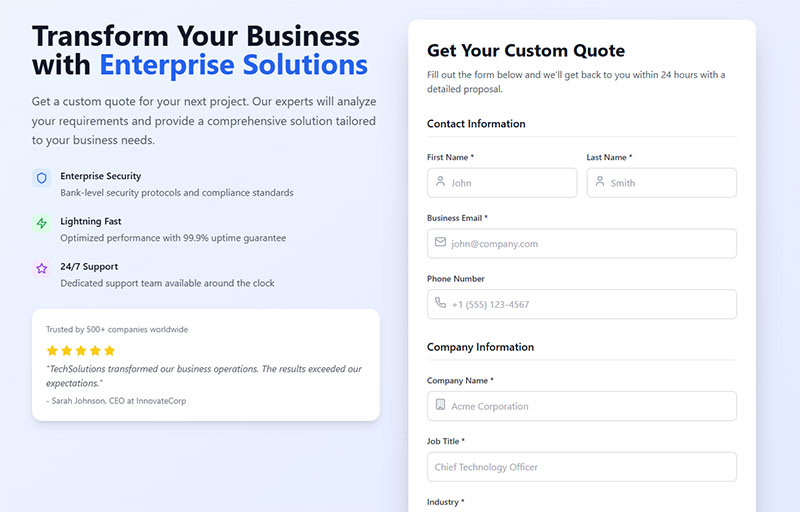
What Role Does Social Proof Play in Form Conversions
Trust elements near forms directly influence submission rates.
A Blue Fountain Media study found that adding a Verisign trust badge to checkout pages increased form conversions by 42%. Security concerns drive 29% of form abandonment, according to research from multiple sources.
Effective social proof includes:
- Customer logos from recognizable companies
- Testimonial quotes from satisfied users
- User count statistics (“Join 50,000+ marketers”)
- Security badges and certifications
- Industry awards or recognition
Research from WiserNotify shows displaying customer reviews increases conversions by up to 270% when five or more reviews are present. Products with positive ratings see a 68% higher likelihood of being chosen.
B2B buyers research extensively before converting.
Data from the Content Marketing Institute’s 2025 report reveals 78% of B2B decision-makers hesitate to share complete contact information during first interactions. Visible proof reduces this friction.
What to display and where:
| Location | Trust Element | Purpose |
|---|---|---|
| Near form | Security badges (SSL, McAfee) | Reduce security concerns |
| Above CTA | Customer testimonials | Provide social proof |
| Header | Customer logos | Build credibility |
| Footer | Certifications | Show legitimacy |
How Does Progressive Profiling Work
Progressive profiling collects additional information across multiple interactions instead of overwhelming visitors upfront.
Marketo’s 2024 Benchmark Report shows progressive profiling increases form completion rates by an average of 35%. The approach reduces form abandonment by up to 45%, per Eloqua’s 2024 study.
How it works:
First form submission captures basic contact details (name, email). Subsequent interactions request additional qualifying information through smart fields that never repeat questions.
HubSpot, Pardot, and ActiveCampaign track previously collected data and automatically adjust visible fields.
Results from implementation:
According to HubSpot Research, progressive profiling improves data quality by 28% through more contextually relevant inquiries. The conversion rate for B2B forms decreases by 7% with each additional required field, making this approach critical for longer qualification processes.
Progressive profiling stages:
| Visit | Fields Requested | Purpose |
|---|---|---|
| 1st visit | Name, email | Initial capture |
| 2nd visit | Company, title | Basic qualification |
| 3rd+ visit | Budget, timeline | Sales readiness |
This approach builds comprehensive lead profiles without overwhelming visitors on initial contact. Marketing qualified leads emerge naturally as you gather more data over time.
Brixon Group analysis from 2025 shows companies combining progressive profiling with lead scoring achieve a 79% higher conversion rate from Marketing Qualified Leads to Sales Qualified Leads.
Performance benchmarks to track:
- Form completion rate (target: 66%+)
- View-to-start rate (target: 45%+)
- Starter-to-completion rate (target: 66%+)
- Average completion time (baseline: 2-3 minutes for contact forms)
Track these metrics weekly to identify drop-off points and optimization opportunities.
How to Qualify B2B Leads Through Forms
What Questions Identify Sales-Ready Leads
Strategic form questions separate high-intent prospects from casual browsers.
Research from Marketo shows B2B companies with data-rich lead scoring models achieve a 35% higher Sales Acceptance Rate. The predictive accuracy drops by 27% when critical demographic and firmographic data are missing.
Budget qualification: “What is your estimated budget for this project?”
Analysis by Formisimo shows budget questions decrease conversion by 15.3%. But companies incorporating this data see dramatically higher close rates.
Timeline identification: “When are you looking to implement a solution?”
Precise timeframe questions reduce conversion by 10.8%, per Brixon Group research. Sales teams gain critical prioritization data.
Authority confirmation: “What is your role in purchasing decisions?”
Modern B2B purchases involve 6-10 decision-makers across departments, according to Intelemark analysis. Identifying authority early streamlines the qualification process.
Need specification: “What primary challenge are you trying to solve?”
Open-ended questions help uncover pain points without adding friction. Leads at Scale research shows asking the right questions can increase lead-to-opportunity conversion by 35%.
Company fit: “How many employees does your company have?”
Employee count fields decrease conversion by 8.5% but provide essential qualification data for sales teams.
The quality versus quantity decision:
Data from Brixon Group reveals forms with more than 5 fields see an average 30% conversion decrease compared to shorter variants. At the same time, 67% of B2B sales teams report they often lack critical information for effective lead qualification.
Longer forms with qualifying questions generate fewer but higher-quality leads. Sales teams spend less time on unqualified prospects.
You can also use survey forms with demographic survey questions to build richer prospect profiles.
Question impact on conversion and quality:
| Question Type | Conversion Impact | Qualification Value |
|---|---|---|
| Company name | -3.2% | High |
| Budget range | -15.3% | Critical |
| Timeline | -10.8% | High |
| Phone number | -18.7% | Medium |
| Employee count | -8.5% | Medium |
Progressive profiling for qualification:
Organizations using progressive profiling techniques that gradually collect qualification data achieve 35% better qualification rates than those requiring extensive upfront information, per Intelemark data.
Start with basic contact info (name, email, company). Second interaction: role and timeline. Third interaction: budget and specific needs.
Companies combining progressive profiling with lead scoring see 79% higher conversion from Marketing Qualified Leads to Sales Qualified Leads, according to Demand Metric’s 2025 report.
AI-driven qualification:
Companies using intent data achieve 4x higher accuracy in identifying sales-ready prospects, research from Data Mania shows. Intent signals from content consumption and pricing page visits indicate active buying processes.
Analysis reveals 68% of eventually qualified opportunities demonstrate specific website engagement patterns including multiple page views, return visits, and pricing interactions.
How Do Hidden Fields Enrich Lead Data
Hidden form fields capture contextual information without adding friction.
InsideView’s 2024 analysis shows companies can reduce visible form fields by 40% through automatic data enrichment without sacrificing lead information quality.
Common hidden field data:
- Traffic source and campaign attribution
- Landing page URL
- Geographic location (from IP)
- Referral source
- UTM parameters
Google Analytics and Google Tag Manager track this data automatically.
Lead enrichment reduces form length:
Chili Piper reduced their demo form from 14 fields to just 2 visible fields (business email plus one question). Clearbit enrichment automatically fills company size, industry, and firmographic data.
Formstack analysis of 650,000+ forms shows conversion improves by 3-5% for every additional form field removed.
Enrichment platforms and their benefits:
Services like Clearbit, ZoomInfo, and 6sense automatically append:
- Company size and revenue
- Industry classification
- Technology stack
- Employee count
- Funding status
Real-time data transmission impact:
Salesforce data shows real-time CRM integration reduces lead response time by 67%. Intelligent lead routing based on enriched information shortens processing time by 38%.
This enriches lead records in Salesforce or Zoho CRM and enables personalized follow-up without requesting additional input.
Enrichment versus manual entry:
Marketo testing found manually entered data has high error rates. VP Marketing Jon Miller states: “Why should I ask for data, hurt my conversion rate and get bad data when I can buy it cheaper?”
B2B data decays quickly as titles change and people leave companies. Enrichment ensures accuracy by pulling from trusted providers.
Performance tracking benchmarks:
| Metric | With Enrichment | Without Enrichment |
|---|---|---|
| Form completion rate | 3-5% higher per field removed | Baseline |
| Data accuracy | 90%+ | 60-70% |
| Lead response time | 67% faster | Baseline |
| Sales team data cleanup time | Minimal | 27% of SDR time wasted |
Implementation priorities:
- Set up basic hidden fields (UTM parameters, page URL, source)
- Integrate enrichment platform (Clearbit, ZoomInfo)
- Configure real-time CRM sync
- Test visible field reduction
- Monitor lead quality metrics
Track qualification rate changes weekly. Compare SQL conversion rates before and after enrichment implementation to measure impact on lead quality.
What Happens After Form Submission
How Should Confirmation Pages Be Designed
The thank-you page is an underused conversion opportunity.
Research from Force24 shows top B2B organizations achieve 10-15% conversion rates on gated content offers. Among those leads, 5-10% progress to genuine sales opportunities.
Marketing-qualified leads generated via gated content convert to sales-qualified leads at a rate 36% higher than other sources, according to industry analysis.
Effective confirmation pages include:
- Clear submission acknowledgment with a strong form submission confirmation message
- Expected response timeline
- Additional resource offers
- Social sharing options
- Calendly scheduling links for demo requests
Strategic next steps on thank-you pages:
High-value gated offers convert up to 11% of visitors, compared with just 2% for standard landing pages, per data from Unbounce analysis.
Use the confirmation page to offer:
- Related content downloads
- Demo scheduling options
- Newsletter subscription
- Social media follow prompts
- Product tour access
A weak registration successful message wastes engagement momentum.
Confirmation page performance benchmarks:
| Element | Conversion Impact |
|---|---|
| Related content offer | 5-10% additional conversion |
| Calendar scheduling link | Up to 11% booking rate |
| Social sharing | 3-5% share rate |
| Newsletter signup | 8-12% opt-in rate |
What Response Time Do B2B Leads Expect
Speed matters for lead conversion.
Harvard Business Review analysis of 15,000 leads shows you decrease your odds of qualifying a lead by 400% when response time goes from 5 to 10 minutes.
Leads contacted within 5 minutes are 21 times more likely to enter the sales process than those contacted after 30 minutes, per MIT Lead Response Management study.
Response time reality check:
Workato’s 2025 study of 114 B2B companies found only 1 company sent a personalized email within 5 minutes. Average email response time: 11 hours and 54 minutes.
Phone response performed worse. Just 31% of companies responded by phone at all. Average phone response time: 14 hours and 29 minutes. None called within 5 minutes.
Industry averages:
The average B2B lead response time is 42 hours, per multiple 2024-2025 studies. RevenueHero research shows 63% of businesses don’t respond at all to inbound leads.
Response speed impact on conversion:
Research shows 78% of customers buy from the first company that responds. Following up within the first minute leads to a 391% increase in conversions compared to waiting just a few minutes, according to Velocify data.
Businesses that respond within an hour are 7 times more likely to qualify the lead. After 30 minutes, leads are 60% less likely to respond.
Automated confirmation emails through Mailchimp or ConvertKit provide immediate acknowledgment.
Sales team follow-up should occur within hours, not days.
Lead routing automation in Microsoft Dynamics or Pipedrive ensures instant assignment.
Response time benchmarks by channel:
| Response Type | Best Practice | Industry Average | Impact |
|---|---|---|---|
| Automated email | Instant | Instant | Baseline expectation |
| Personalized email | Under 5 minutes | 11 hours 54 min | 100x conversion lift |
| Phone call | Under 5 minutes | 14 hours 29 min | 21x qualification rate |
| Demo scheduling | Instant via calendar | 24-48 hours | 2x conversion rate |
How Should Lead Nurturing Sequences Begin
Not all form submissions indicate immediate purchase readiness.
Forrester Research shows only 5% of leads are sales-ready when first generated. That means 95% require additional nurturing.
Research indicates 73% of B2B leads are not sales-ready when generated, according to multiple industry studies.
Nurturing impact on revenue:
Companies that excel at lead nurturing generate 50% more sales-ready leads at 33% lower cost, per Salesforce study.
Nurtured leads make 47% larger purchases than non-nurtured leads, data from marketing automation analysis shows.
Nurture sequences maintain engagement through:
- Educational email content
- Relevant case studies
- Industry insights
- Product updates
- Personalized resource recommendations
Email nurturing performance:
Lead nurturing emails generate an 8% click-through rate compared to general email sends at 3% CTR, according to 2024 benchmarking data.
Email marketing for lead nurturing has 4 to 10 times higher response rates than general campaigns.
Nurturing frequency and timing:
Analysis shows 22% of B2B companies nurture leads weekly. However, companies implementing systematic nurturing programs see 23% faster sales cycles for nurtured leads.
Marketing automation platforms handle this at scale.
Lead nurturing effectiveness benchmarks:
| Nurturing Activity | Conversion Impact | Response Rate |
|---|---|---|
| Email sequences | 8% CTR | 4-10x higher than standard |
| Content offers | 36% higher SQL rate | Varies by content type |
| Personalized outreach | 63% conversion boost | Significantly higher |
| Automated workflows | 451% more qualified leads | Dramatic improvement |
Implementation priorities:
- Set automated confirmation emails (instant delivery)
- Configure lead routing rules (under 5 minute assignment target)
- Build nurture email sequences (weekly cadence minimum)
- Design high-value thank-you pages (include calendar scheduling)
- Enable real-time alerts for sales team (mobile and desktop)
Performance tracking:
Monitor these metrics weekly:
- Average response time (target: under 5 minutes)
- Contact rate (target: 70%+ of leads contacted)
- Nurture sequence open rates (benchmark: 8% CTR)
- Thank-you page conversion rate (target: 5-10%)
- Lead-to-opportunity conversion (qualified leads: 40% vs unqualified: 11%)
79% of marketing leads never convert due to lack of nurturing. Systematic follow-up and nurturing processes prevent this revenue loss.
What Are B2B Lead Form Conversion Benchmarks
What Conversion Rates Should B2B Companies Expect
Average B2B lead conversion rates range from 2% to 5% across industries.
Ruler Analytics’ 2025 analysis of over 100 million data points shows the median B2B conversion rate across all industries is 2.9%.
Check current conversion rate benchmarks for your specific vertical.
Industry-specific benchmarks vary significantly:
Data from multiple 2024-2025 studies reveals:
- Legal services: 7.4% (highest performing B2B sector)
- Professional services: 4.6%
- Financial services: 3-4%
- Manufacturing: 3-5%
- Healthcare: 3-4%
- HVAC services: 3.1%
- Technology/SaaS: 1.1-3% (varies by product complexity)
- B2B eCommerce: 1.8%
- IT services: 1.5%
- Engineering: 1.2%
Landing page conversion rates for B2B average around 6.6% per Unbounce’s Q4 2024 analysis of 41,000 landing pages with 464 million visitors.
Top B2B companies achieve average conversion rates of 11.70%, according to Userpilot’s SaaS metrics report. That means for every 100 visitors, about 12 convert into leads or trial users.
Conversion rate context matters:
First Page Sage’s 2025 analysis shows B2B SaaS landing pages convert at 1.1% on average, while the overall B2B website average sits at 2.9%. The 311% difference between highest (legal services at 7.4%) and lowest (B2B eCommerce at 1.8%) performers demonstrates how industry vertical impacts expected rates.
These numbers fluctuate based on traffic quality, offer strength, and form optimization efforts.
Channel performance benchmarks:
Analysis from First Page Sage and Ruler Analytics 2025 studies shows:
| Channel | Average Conversion Rate |
|---|---|
| Referral traffic | 2.9% |
| Organic search | 2.6-2.7% |
| Email marketing | 2.4% |
| Paid search | 1.5-3.2% |
| Social media | <1% |
Funnel stage conversion rates:
Beyond top-line website conversion, B2B buyers progress through multiple stages. Average B2B funnels convert:
- 2.3% of website visitors to leads
- 31% of leads to Marketing Qualified Leads (MQL)
- 13% of MQLs to Sales Qualified Leads (SQL)
- 30-59% of SQLs to opportunities
- 22-30% of opportunities to customers
B2B SaaS organizations demonstrate superior qualification performance with 39% lead-to-MQL conversion rates, significantly exceeding the 31% cross-industry average.
How Do Different Industries Compare
Industry context shapes realistic expectations.
Sales cycle length impacts conversion:
Research shows B2B sales cycles increased 25% between 2019 and 2024. Companies with longer sales cycles naturally show lower immediate conversion metrics.
For simpler products, sales close in 1-3 months. Complex solutions require 6 months or more. While 74.6% of B2B deals wrap up in 4 months or less, extended timelines depress top-of-funnel conversion rates.
Offer type drives conversion differences:
High-intent pages like demo requests convert at higher rates than informational downloads.
Gated content conversion data from Force24 shows:
- High-value gated offers: up to 11% conversion
- Standard landing pages: 2% conversion
- Marketing-qualified leads from gated content convert to SQLs at a rate 36% higher than other sources
Sales and marketing alignment impact:
Top-performing companies with aligned sales and marketing teams dramatically outperform misaligned competitors.
Research from multiple 2024-2025 studies shows aligned teams:
- Generate 208% more revenue from marketing efforts
- Achieve 67% better closing rates
- See 38% higher sales win rates
- Experience 36% higher conversion rates
- Enjoy 27% faster profit growth over three years
- Achieve 20% annual growth rates
- Convert 65% more prospects to pipeline when marketing actively supports sales
Companies with strong sales and marketing alignment are 67% better at closing deals, according to ZoomInfo data.
Only 8% of companies have strong alignment between sales and marketing departments. This creates massive opportunity for improvement.
Misalignment costs:
Failure to align sales and marketing teams costs B2B companies 10% or more of revenue per year. An estimated $1 trillion annually is lost in the US alone due to lack of coordination.
79% of marketing leads never convert into sales, often due to lack of nurturing and misalignment between teams.
Industry-specific contexts:
Lead generation for SaaS differs significantly from lead generation for financial advisors or lead generation for agencies.
Know your vertical benchmarks before setting targets.
Performance improvement benchmarks:
| Metric | Industry Average | Top Performers | Improvement Opportunity |
|---|---|---|---|
| Website conversion | 2.9% | 11.7% | 4x potential lift |
| Lead-to-MQL | 31% | 39% (SaaS) | 26% improvement |
| MQL-to-SQL | 13% | 40% (behavioral scoring) | 3x improvement |
| Sales win rate (aligned teams) | Baseline | 38% higher | Significant lift |
What drives the 311% gap between industries:
- Sales cycle complexity (6-10 decision-makers in B2B purchases)
- Transaction value (higher prices = more scrutiny)
- Product complexity (technical solutions require longer evaluation)
- Market maturity (established vs emerging categories)
- Buyer intent level (problem-aware vs solution-aware)
Companies seeing 15% boost in conversion rates compared to 2023, showing overall positive trend despite industry variations.
How to Test and Optimize B2B Lead Forms
What Form Elements Should Be A/B Tested
Testing reveals what resonates with your specific audience.
Companies using A/B testing see up to 30% improvement in conversion rates, according to Bliss Drive’s 2024 analysis. Yet only 17% of marketers use landing page A/B tests to improve conversion rates.
A/B testing delivers measurable ROI: companies using dedicated CRO tools see an average return of 223%, according to multiple 2024 studies.
Priority test elements:
- Number of form fields: Most forms contain 11 fields on average. Reducing this to just 4 fields can increase conversions by 120%. Forms with 3 fields see conversion rates as high as 25%, compared to 15% for forms with more than 6 fields.
- Field order sequence: Field-by-field testing shows which sequences reduce friction
- CTA button copy and color: Personalized CTAs yield 42% higher conversion than generic ones. CTA text using action verbs like “Get,” “Try,” or “Download” outperforms bland labels like “Submit”
- Form headline messaging: Testing headlines can yield 10-30% gains
- Value proposition language: Clear value exchange increases completion
- Form placement on page: Above-fold placement sees better conversion
- Inline forms or popup forms format: Popupsmart’s 2025 analysis of 10,000+ campaigns shows average popup conversion rate of 3.49%
Multi-step forms outperform single-page forms:
Data shows multi-step forms have a 13.85% average completion rate compared to 4.53% for single-page forms. Breaking forms into manageable steps reduces perceived effort.
Field optimization insights:
Over 30% of marketers report highest conversion rates from forms with 4 fields. However, Zuko’s latest data shows form length alone doesn’t determine success. The trend line plotting number of fields against completion rate is flat, indicating field relevance matters more than quantity.
Progressive profiling and smart forms:
Tools like HubSpot allow displaying new questions to returning users each time, building complete profiles without overwhelming visitors initially.
Testing proves critical:
56% of marketers identify A/B testing as their highly preferred conversion optimization method. VWO data from 2025 shows companies with mature testing programs run 50% more tests than average performers.
Optimizely and similar tools make split testing straightforward.
Learn to optimize forms systematically for continuous improvement.
How Should Form Analytics Be Tracked
Form analytics reveal abandonment points and completion patterns.
Form abandonment statistics from 2024-2025 research:
81% of people have abandoned at least one web form. Of those who view a form, only 49% actually start filling it out. Of visitors who start, only 16.5% complete it.
More than 67% of site visitors will abandon forms permanently if they face any complications. Only 20% will follow up with the company in some way.
Key metrics to monitor:
Form view to submission rate:
- Average form conversion rate across all industries: 1.7%
- Application forms: 75% completion rate (highest)
- Contact forms: lowest conversion
- Two-thirds of people who start filling out a form successfully complete it
Field-by-field abandonment:
Zuko Analytics data reveals:
- Password fields have highest abandonment rate at 10.5%
- Email and phone fields cause significant drop-out (6.4% and 6.3% respectively)
- Name fields show lowest abandonment with 3.5-second average completion time
- Field returns (users returning to previously filled fields) average 5.6 for completed sessions vs 4.6 for abandoned sessions
Time to completion:
Average form abandonment occurs at 1 minute 43 seconds. Users who abandon recruitment forms spend 1 minute 40 seconds on forms, while successful completers spend 1 minute 25 seconds (indicating users get lost before frustration sets in).
Industry-specific completion times:
- Checkout forms: 3 minutes 21 seconds (longest)
- Property sector forms: 7.5 minutes
- Local government forms: 8+ minutes
Submission error frequency:
Inline form-field validation causes a 22% decrease in form errors and decreases completion time by 42%, according to CXL research.
Mobile vs. desktop completion rates:
Desktop users convert at higher rates than mobile users across all verticals.
| Device | Conversion Rate | Start-to-Completion Rate |
|---|---|---|
| Desktop | 3.2% average | 55.5% |
| Mobile | 2.8% average | 47.5% |
| Tablet | – | 41.13% |
Mobile-specific challenges:
- 47% of users abandon forms taking longer than 3 minutes to complete
- Complex forms with more than 5 fields show 68% abandonment rate on mobile
- Simplified mobile forms see up to 63% higher completion rates
- Mobile pages load 70-80% slower than desktop, directly impacting conversions
Browser performance data:
Edge users show highest view-to-conversion rate at 46.7% across all forms. Chrome has highest starter-to-completion rate overall.
Source-based conversion differences:
Tracking source performance reveals which channels deliver quality traffic. Paid search delivers 2.9% conversion rate, organic search 2.8%, referral traffic 2.6%, and social media <1%.
Form analytics tools and tracking:
Use Google Analytics or Google Tag Manager to track form abandonment events. Tools like MonsterInsights simplify setup.
Advanced tracking captures:
- Which fields users interacted with before abandoning
- Complete “history” of field interactions (example: firstName > lastName > address > creditCardNumber)
- Time spent per field
- Number of field returns
Recovery tactics:
20% of partial form responders will return and complete the form if sent a link to the incomplete form. Capturing partial entries allows follow-up with users who abandoned.
Form optimization priorities based on data:
- Reduce fields from 11 to 4 for 120% conversion increase
- Implement inline validation for 22% fewer errors
- Use multi-step forms (13.85% completion vs 4.53% single-page)
- Optimize mobile experience (simplify for 63% higher completion)
- Add trust badges (reduces 12% abandonment at checkout)
- Remove required account creation (eliminates 23% abandonment)
- Use autofill (increases conversion by 10%+)
Heatmaps and session recordings show actual user behavior during form interaction.
Clear form error messages reduce frustration and recover potential submissions.
Track everything through Google Analytics or your marketing automation platform.
What Tools Support B2B Lead Form Creation
What Form Builder Platforms Exist
Popular B2B form solutions vary by platform and needs.
For WordPress sites, explore WordPress lead generation plugins and WordPress contact form plugins.
Budget-conscious teams can start with free WordPress form plugins.
Standalone options include Typeform for conversational forms, Formstack for advanced features, Unbounce for landing page integration, and JotForm for template libraries.
Selection criteria: CRM integration, conditional logic capabilities, analytics features, and mobile optimization.
Need advanced routing? Look for a form builder with conditional logic.
How Should Forms Integrate with CRM Systems
Direct CRM integration eliminates manual data entry and ensures immediate lead routing.
Proper integration enables:
- Automatic lead record creation
- Field mapping to CRM properties
- Lead scoring trigger activation
- Sales notification automation
- Marketing automation enrollment
Zapier connects forms to virtually any CRM.
Native integrations between HubSpot Forms, Salesforce, Marketo, and Pardot streamline the process.
WordPress email settings configuration ensures notifications reach your sales team instantly.
FAQ on How to Generate B2B Leads
What is the ideal number of form fields for B2B lead generation?
Top-of-funnel forms perform best with 2-3 fields. Bottom-of-funnel demo requests can include 5-7 qualifying fields. Research shows reducing one field can boost conversions by nearly 50%. Balance data needs against completion rates.
How can I reduce form abandonment on my B2B website?
Use multi-step form templates to break long forms into digestible steps. Make phone numbers optional, add progress indicators, and ensure mobile responsiveness. Clear value propositions and trust signals near forms also reduce drop-off significantly.
What form fields qualify B2B leads effectively?
Company size, job title, budget range, and project timeline separate serious buyers from browsers. These fields help sales teams prioritize outreach. Add industry vertical for better segmentation within your marketing automation platform.
Should I use popups or embedded forms for B2B lead capture?
Both work. Embedded forms suit high-intent pages like pricing. Popup forms capture attention on blog content. Test different types of popups including timed triggers and scroll-based displays for your audience.
How quickly should I follow up with form submissions?
Within five minutes. Leads contacted immediately convert at significantly higher rates than those contacted after 30 minutes. Use lead routing automation in Salesforce or HubSpot to notify sales teams instantly upon submission.
What CTA button text converts best on B2B forms?
Action-specific phrases outperform generic text. “Get Your Free Audit” or “Schedule My Demo” beat “Submit” every time. One study showed changing a single CTA word increased qualified leads by 221%.
How do I make forms GDPR compliant for European leads?
Add explicit consent checkboxes, link to your privacy policy, and explain data usage clearly. Review GDPR consent form examples for proper implementation. Store consent records and honor data deletion requests promptly.
What conversion rate should B2B forms achieve?
Average B2B form conversion rates range from 2-5%. Professional services hit around 12%. High-intent demo request pages convert better than informational downloads. Benchmark against your industry vertical, not general averages.
How do hidden form fields improve lead quality?
Hidden fields capture UTM parameters, traffic source, and landing page URL without adding friction. This data enriches CRM records in Pipedrive or Zoho CRM, enabling personalized follow-up and accurate campaign attribution.
What tools integrate B2B forms with CRM systems?
Zapier connects virtually any form to any CRM. Native integrations exist between HubSpot Forms, Salesforce, Marketo, and Pardot. For WordPress sites, many web forms plugins offer direct CRM connections.
Conclusion
Learning how to generate B2B leads using website forms comes down to strategic design, smart field selection, and relentless optimization.
Every element matters. Form length, CTA copy, placement, mobile responsiveness, and follow-up speed all impact your conversion rate.
Start with the basics. Build forms that collect essential qualifying data without overwhelming prospects.
Integrate with your CRM, whether that’s HubSpot, Salesforce, or ActiveCampaign. Set up lead nurturing sequences through marketing automation.
Test continuously. A/B test your CTAs, field order, and value propositions.
Track form analytics to identify abandonment points.
The companies winning at B2B lead generation treat their forms as conversion assets, not afterthoughts. Small improvements compound into significant pipeline growth over time.
