

A blank quiz builder staring back at you is where most people quit. The questions feel off, the scoring logic gets confusing, and the whole thing takes three times longer…
Table of Contents
Most companies guess what customers think. The successful ones measure it.
Customer satisfaction survey templates give you a tested framework for collecting feedback that actually drives decisions.
No starting from scratch. No wondering if your questions make sense.
Whether you need to measure Net Promoter Score, track CSAT after support interactions, or gather product feedback, the right template cuts setup time from hours to minutes.
This guide covers the major satisfaction metrics, industry-specific templates, question types, distribution methods, and the tools that make it all work.
You’ll also learn what mistakes tank response rates and how to avoid them.
What is a Customer Satisfaction Survey Template
A customer satisfaction survey template is a pre-built questionnaire designed to collect feedback about products, services, or overall brand experience.
It includes standardized questions, rating scales, and response formats that businesses can customize for their specific needs.
Companies use these templates to measure satisfaction scores, track customer sentiment over time, and identify areas for improvement.
The structure typically combines closed-ended questions (like Likert scales) with open-ended prompts for qualitative insights.
Examples of Customer Satisfaction Survey Templates
Customer Satisfaction Score (CSAT)
See the Pen
Modern CSAT Template by Bogdan Sandu (@bogdansandu)
on CodePen.
Net Promoter Score (NPS)
See the Pen
Modern NPS Survey UI by Bogdan Sandu (@bogdansandu)
on CodePen.
Customer Effort Score (CES)
See the Pen
Modern Customer Effort Score (CES) Survey Template by Bogdan Sandu (@bogdansandu)
on CodePen.
Post-Purchase Survey
See the Pen
Modern Post-Purchase Survey Template by Bogdan Sandu (@bogdansandu)
on CodePen.
Post-Support Survey
See the Pen
Post-Support Survey – Modern UI Design by Bogdan Sandu (@bogdansandu)
on CodePen.
Product Feedback Survey
See the Pen
Modern Product Feedback Survey by Bogdan Sandu (@bogdansandu)
on CodePen.
User Onboarding Survey
See the Pen
Modern User Onboarding Survey by Bogdan Sandu (@bogdansandu)
on CodePen.
Website Usability Survey
See the Pen
Modern Website Usability Survey by Bogdan Sandu (@bogdansandu)
on CodePen.
Churn / Exit Survey
See the Pen
Modern Churn/Exit Survey UI by Bogdan Sandu (@bogdansandu)
on CodePen.
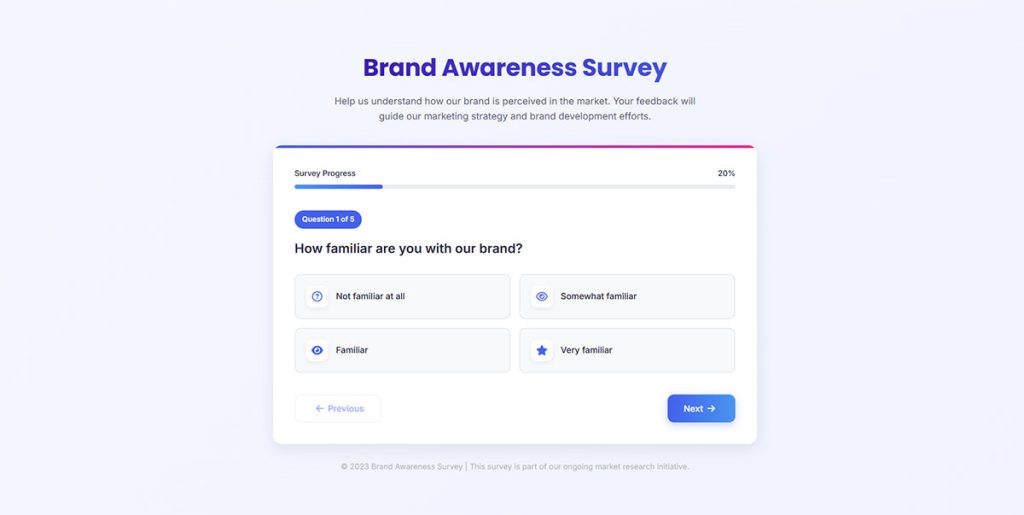
Brand Awareness Survey
See the Pen
Brand Awareness Survey With Modern UI Design by Bogdan Sandu (@bogdansandu)
on CodePen.
Market Research Survey
See the Pen
Market Research Survey by Bogdan Sandu (@bogdansandu)
on CodePen.
Milestone Survey
See the Pen
Modern Milestone Survey Template by Bogdan Sandu (@bogdansandu)
on CodePen.
Beta Test Survey
See the Pen
Modern Beta Test Survey UI by Bogdan Sandu (@bogdansandu)
on CodePen.
Why Do Companies Use Customer Satisfaction Survey Templates
Templates save hours. Building a questionnaire from scratch takes 3-4 hours. A template takes 15 minutes.
Standardization enables benchmarking. When you use consistent types of survey questions, you compare results across time periods, locations, or customer segments.
Research from IT Tool Kit shows businesses using structured satisfaction surveys report 73% higher customer retention rates. Bain and Company data reveals increasing retention by 5% can boost profits by 25-95%.
Error reduction matters. Data from SurveyMonkey shows surveys with 10 questions achieve 89% completion, while 40-question surveys drop to 79%. Pre-tested templates eliminate poorly worded questions that skew data.
Implementation Wins
- Deploy across touchpoints in under 30 minutes
- Collect consistent data for trend analysis
- Train teams faster with standardized formats
- Build in proven question design
Design Rules That Work
Keep surveys under 7 minutes. Completion rates drop significantly after 12 minutes. Surveys with 5-10 well-designed questions achieve 32% higher completion rates than longer alternatives.
Start with multiple-choice questions. Surveys opening with simple multiple-choice achieve 89% completion versus 83% for those starting with open-ended questions.
Optimize for mobile. According to Kantar, 80%+ of people complete surveys on mobile devices in most markets. Templates need mobile-first design.
Time it right. Research from Freshworks confirms response times have the greatest impact on customer satisfaction scores. Send surveys within 2 hours of customer interactions for 32% more completions.
Limit questions to 10-15 maximum. Surveys with 1-3 questions achieve 83% completion, while 15+ questions drop to 42%.
How to Measure Customer Satisfaction with Surveys
Three metrics dominate satisfaction measurement: NPS, CSAT, and CES. Each serves a different purpose. Choosing the right one depends on what you want to learn and when you ask.
Net Promoter Score (NPS) Surveys
Net Promoter Score measures loyalty through one question: “How likely are you to recommend us?” Responses fall into Promoters (9-10), Passives (7-8), and Detractors (0-6).
Calculate by subtracting Detractor percentage from Promoter percentage. Scores range from -100 to +100. Data from Nicereply shows the average NPS across customer surveys is +17, while anything above 50 is excellent.
When to use NPS:
- Quarterly or semi-annual relationship surveys
- After customers complete onboarding
- At key lifecycle milestones
Research shows NPS surveys achieve 10-30% response rates compared to just 3% for standard surveys. Fred Reichheld developed NPS at Bain and Company in 2003 as a predictor of business growth. Learn more about crafting effective NPS survey questions for your business.
Send your first NPS survey after customers have fully experienced your product, not immediately after signup. For ongoing measurement, use quarterly cadence to monitor sentiment without causing survey fatigue.
Customer Satisfaction Score (CSAT) Surveys
CSAT measures satisfaction with a specific interaction using a 1-5 or 1-7 scale. Calculate by dividing satisfied responses (4-5) by total responses, then multiply by 100.
Nicereply data shows the average CSAT score across all responses is 8.59 out of 10. According to COPC benchmarks, world-class targets are 85% or higher top-two scores and 5% or lower bottom-box scores. For SaaS and ecommerce, aim for 80% minimum.
Best deployment points:
- Immediately after purchase or signup
- Post-support ticket resolution
- Following onboarding completion
- After product feature usage
Expect 5-20% response rates for CSAT surveys. Gartner recommends CSAT for touchpoint-specific measurement because it captures immediate satisfaction when experiences are fresh.
Send CSAT surveys within hours of the interaction, not days later. Memory fades quickly, and delayed surveys produce less accurate data. For product feedback, wait until customers have spent enough time with the feature to form an opinion.
Customer Effort Score (CES) Surveys
CES asks: “How easy was it to accomplish your goal?” Research shows lower effort predicts higher loyalty better than satisfaction alone.
Use a 1-7 scale, from “Very Difficult” to “Very Easy.” Nicereply data shows the average CES score is 5.99 out of 7. Calculate by dividing the number of ratings 5-7 by total responses, then multiply by 100.
Deploy CES after:
- Support ticket resolution
- Self-service portal interactions
- Account setup or configuration
- Payment or checkout processes
Data from Creovai shows 50% of customers leave after one bad service experience, making CES critical for retention. Send immediately after the interaction while details are fresh.
Implementation Strategy
Use all three metrics together for complete visibility. Track CSAT and CES after every interaction to monitor quality and ease. Run NPS surveys quarterly to measure if improvements boost loyalty.
Keep surveys mobile-friendly. Research from Kantar confirms 80%+ of people complete surveys on mobile devices. One question plus an optional open-ended follow-up works best.
Always include “why” questions. Open-ended responses provide context that scores alone cannot reveal. Ask “What was the main reason for your score?” to uncover specific pain points.
Types of Customer Satisfaction Survey Templates by Industry
Different industries need different questions. A retail survey won’t work for a hospital.
Here are templates tailored to specific sectors.
Retail Customer Satisfaction Survey Template
See the Pen
Customer Satisfaction Survey by Bogdan Sandu (@bogdansandu)
on CodePen.
Focus areas: purchase experience, product quality, store environment, staff helpfulness, checkout speed.
Include post-purchase survey questions about product condition and delivery timing. Ask about return policy clarity.
SaaS Customer Satisfaction Survey Template
See the Pen
SaaS Customer Satisfaction Survey by Bogdan Sandu (@bogdansandu)
on CodePen.
Measure onboarding experience, feature usage satisfaction, support quality, and renewal likelihood.
Ask about pricing perception and missing features. Time surveys after key milestones: 30 days, 90 days, annual renewal.
Healthcare Customer Satisfaction Survey Template
See the Pen
Healthcare Survey Template by Bogdan Sandu (@bogdansandu)
on CodePen.
Patient experience surveys cover wait times, staff communication, facility cleanliness, and treatment outcomes.
HCAHPS (Hospital Consumer Assessment of Healthcare Providers and Systems) sets the standard in the US. Privacy compliance is mandatory. Organizations focused on lead generation for healthcare often integrate satisfaction data with patient acquisition strategies.
Hospitality Customer Satisfaction Survey Template
See the Pen
Hospitality Guest Experience Survey by Bogdan Sandu (@bogdansandu)
on CodePen.
Cover booking experience, room quality, amenities, staff service, and overall stay satisfaction.
JD Power benchmarks hospitality satisfaction annually. Hotels combining satisfaction surveys with lead generation for hotels see stronger repeat booking rates.
E-commerce Customer Satisfaction Survey Template
See the Pen
E-commerce Customer Satisfaction Survey Template by Bogdan Sandu (@bogdansandu)
on CodePen.
Key areas: website usability, product selection, checkout experience, delivery speed, packaging quality.
Include survey questions about product quality matching descriptions. Ask about return process satisfaction. Businesses integrating surveys with lead generation for ecommerce capture both feedback and future sales opportunities.
What Questions to Include in a Customer Satisfaction Survey
Question format affects response quality and completion rates. Mix formats strategically based on what you need to learn.
Rating Scale Questions
Likert scales (Strongly Disagree to Strongly Agree) work for attitude measurement. Numeric scales (1-10) work for satisfaction scoring.
Five-point scales reduce cognitive load. Research from Nimbli shows 5-point scales achieve 20% higher completion rates than 7-point scales. Use these for quick, straightforward feedback when surveying time-pressed respondents.
Seven-point scales capture nuance. Data from ResearchGate reveals 7-point scales offer 15% more precise data, ideal for complex topics requiring subtle distinctions. Best for experienced respondents comfortable with finer gradations.
Avoid even-numbered scales (4-point, 6-point) unless you want to force definitive opinions. Research from MeasuringU confirms scales with 5-7 points provide optimal balance between reliability and usability, with diminishing returns after 11 points.
Open-Ended Questions
Place these after rating questions to capture context. Data from SurveyMonkey shows surveys opening with open-ended questions achieve 83% completion versus 89% for those starting with multiple-choice.
Limit to 2-3 per survey. Surveys with 10 open-ended questions drop to 78% completion compared to 88% for surveys with just one open-ended question. Each additional open-ended question increases dropout risk.
Use focused prompts:
- “What could we improve?”
- “What almost stopped you from purchasing?”
- “What was the main reason for your score?”
Set character limits around 500 words. SurveyMonkey data confirms each additional word in question text negatively impacts completion rates. Keep questions concise to maintain momentum.
Multiple Choice Questions
Use for demographic data, feature preferences, or categorizing feedback types. Keep choices under 7 to prevent decision fatigue.
Include “Other” with a text field when options aren’t exhaustive. This captures unexpected responses while maintaining structure.
Research from Kantar shows complex language or technical jargon causes respondents to skip questions or abandon surveys. Matrix questions, while tempting for gathering bulk data, lead to dropout due to length and complexity.
Best practices:
- Use simple, direct language
- Avoid technical jargon
- Group similar questions together
- Maintain consistent option ordering
Binary Questions
Yes/No or thumbs up/down formats maximize response rates. According to the 2025 Mobile Engagement Report, SMS surveys using simple binary responses achieve 45-60% response rates compared to email’s 6-8%.
Perfect for quick pulse checks. Use for:
- “Did we resolve your issue?”
- “Would you buy again?”
- “Was this article helpful?”
Simple, fast, high completion. Binary questions work especially well on mobile devices, where Kantar data confirms 80%+ of people complete surveys.
Implementation Strategy
Start surveys with simple multiple-choice questions to build momentum. Follow with rating scales, then add 1-2 open-ended questions for context.
Keep total survey under 7 minutes. Research shows completion rates drop significantly after 12 minutes. Limit to 10-15 questions maximum.
Design for mobile first. Use clear labels on all scale points, not just endpoints. Maintain consistent formatting throughout to avoid confusing respondents.
How to Structure a Customer Satisfaction Survey Template
Structure determines completion rates. Poor flow kills responses.
Question Order Strategy
Start with easy questions to build momentum. Data from SurveyMonkey shows surveys opening with simple multiple-choice achieve 89% completion versus 83% for those starting with open-ended questions.
Save sensitive or complex questions for the middle when engagement peaks. Research confirms data quality gets worse as surveys progress, with respondents rushing through later questions.
Place demographics at the end. People answer personal questions more readily after investing time in earlier sections.
Time and Length Limits
Keep total length under 5 minutes. Research from Buildform shows surveys under 7 minutes achieve best completion rates, while those over 12 minutes see significant dropout.
Data reveals stark completion differences:
- 1-3 questions: 83.3% completion
- 4-8 questions: 65.2% completion
- 9-14 questions: 56.3% completion
- 15+ questions: 41.9% completion
People give 40% more accurate feedback right after an interaction compared to waiting 24 hours. Send surveys immediately when experiences are fresh.
Progress Indicators
Add progress bars to multi-step forms. Research from Reform shows progress indicators increase completion by 43% by reducing anxiety about remaining time.
Clear visual progression activates psychological completion triggers. Users who can see advancement are more likely to finish, with studies showing multi-step forms achieve 86% higher conversion rates than single-step forms.
Progress bar best practices:
- Show current step and percentage complete
- Display remaining questions, not just completed ones
- Use friendly messages like “You’re nearly done”
- Enable mobile-responsive design
Multi-Step vs Single-Step Forms
Use multi-step forms for 10+ questions. Data from IvyForms shows multi-step approaches can boost conversion rates by up to 300% compared to single-page formats.
When to use multi-step:
- Surveys longer than 5 minutes
- Complex qualification processes
- Forms requiring sensitive information
- Mobile-first survey designs
When to use single-step:
- Quick pulse checks (1-3 questions)
- Simple feedback requests
- Newsletter signups
- Binary decision surveys
Studies show splitting forms into 2-3 steps almost always increases completion rates. Modal pop-ups placed centrally achieve 39.9% completion, while corner placements get minimal engagement.
Essential Structure Elements
Brief introduction (30 words maximum):
- Explain purpose clearly
- Provide time estimate
- State how feedback will be used
Screening questions first if segmenting responses. This filters irrelevant respondents early and reduces wasted time.
Core satisfaction questions in the middle when engagement peaks and attention is highest.
Demographics and open-ended questions at the end after respondents have invested effort.
Thank you page with:
- Acknowledgment of submission
- Next steps or timeline
- Incentive delivery if promised
- Optional social sharing
Solid form design includes clear section headers and logical groupings. Use white space strategically to reduce cognitive burden by 31%.
Mobile Optimization
Design mobile-first. Research from Kantar confirms 80%+ of people complete surveys on mobile devices in most markets.
Use larger tap targets, avoid horizontal scrolling, and minimize excessive scrolling. Studies show mobile-responsive designs increase completion rates across all device types.
Auto-save functionality prevents data loss if users close browsers. This feature significantly reduces abandonment and improves confidence in longer forms.
Consider multi-step forms or single-step forms based on survey length. Pagination works better for 10+ questions; single screens work for quick checks.
Always include a form submission confirmation message that acknowledges the response and sets expectations.
Customer Satisfaction Survey Distribution Methods
Right channel, right timing. Both matter equally.
Email Surveys
Send within 24-48 hours of interaction for highest recall accuracy. Subject lines mentioning “quick feedback” or specific transaction details boost open rates 20-30%.
Mobile-responsive design is mandatory since 60%+ of emails open on phones.
In-App Surveys
Trigger after key actions: purchase completion, feature usage, support resolution. Microsurveys (1-3 questions) work best here.
If you run a WordPress site, WordPress survey plugins simplify in-app deployment.
SMS Surveys
Response rates hit 30-45%, far above email averages. Keep to 1-2 questions maximum due to character limits.
Best for transactional feedback: delivery confirmation, appointment follow-up, service completion. Requires opt-in compliance.
Website Pop-up Surveys
Use exit intent popup triggers to catch visitors before they leave. Limit frequency to once per session.
Page-specific deployment captures contextual feedback. Product pages get product questions; checkout pages get process questions. Understanding inline forms or popup forms helps choose the right approach for each page type.
How to Analyze Customer Satisfaction Survey Results
Collecting data means nothing without proper analysis. Raw numbers need context and comparison.
Response Rate Evaluation
Start with response rate calculation: completed responses divided by total invitations sent, multiplied by 100.
Benchmark targets:
- 20-30%: Respectable range for email-based surveys in 2025
- Above 30%: Top-quartile performance for most B2C sectors
- Below 10%: Critical red flag signaling distribution or design problems
Data from Clootrack shows 22% puts you ahead of three-quarters of B2B SaaS peers. Response rates below 5% are unreliable and skewed toward extreme opinions.
For statistical validity, you need minimum 100 responses. CloudResearch confirms 384 responses deliver ±5% margin of error at 95% confidence level for large populations.
Segment Analysis
Calculate satisfaction scores by segment: product line, customer tenure, purchase value, geographic region. Aggregates hide patterns that matter.
Critical segments to analyze:
- New customers (0-3 months) vs. established (1+ year)
- High-value vs. low-value purchasers
- Geographic regions or locations
- Product categories or service types
- Acquisition channel (organic, paid, referral)
Compare completion rates between segments. High participation (90%) with low completion (75%) signals surveys that start strong but lose respondents, pointing to question sequence or length issues.
Statistical Significance Testing
For samples under 100 responses, statistical significance becomes questionable. Data from SurveyPlanet shows:
- 1,000 population needs 278 responses (95% confidence, 5% margin of error)
- 10,000 population needs 370 responses
- 100,000+ population needs 384 responses
Maximum margin of error for 100 responses is 9.8%. This means a 60% satisfaction score could actually represent 50-70% of your total population.
Industry Benchmarking
The American Customer Satisfaction Index (ACSI) benchmarks scores by industry on a 0-100 scale. Q4 2024 national average sits at 77.3 across 428 companies in 45 industries.
ACSI score interpretation:
- Above 80: Excellent performance
- 70s range: Average, room for improvement
- Below 70: Significant issues requiring attention
High-performing industries include e-commerce, personal care products, and consumer electronics. Cable TV, airlines, and telecommunications consistently score lower.
Research from ACSI shows companies with higher satisfaction scores achieved 18.03% annualized stock returns versus 10.78% for S&P 500 from 2006-2025.
Trend Analysis
Track scores across time periods to identify patterns. Look for:
- Month-over-month changes
- Seasonal variations
- Impact of product launches or changes
- Correlation with business metrics
People give 40% more accurate feedback immediately after interactions versus waiting 24 hours. Compare survey timing with score trends to identify timing issues.
Verbatim Coding
Code open-ended responses into themes. According to research, open-ended questions provide context that scores alone cannot reveal.
Coding process:
- Read 10-15% of responses to identify themes
- Create code categories (max 10-12)
- Assign codes to all responses
- Calculate frequency by theme
- Cross-reference with quantitative scores
Common themes: product quality, customer service, pricing, ease of use, shipping/delivery.
Correlation Analysis
Link satisfaction scores to business outcomes:
- Customer retention rates
- Repeat purchase frequency
- Average order value
- Lifetime value
Research shows 93% of customers make repeat purchases with companies offering excellent service. Track which satisfaction drivers correlate strongest with retention.
For comprehensive guidance on analyzing survey data, combine quantitative metrics with qualitative insights for complete understanding.
Action Planning
Transform insights into specific improvements. Prioritize based on:
- Impact on satisfaction (correlation strength)
- Ease of implementation
- Cost to fix
- Frequency mentioned in verbatim
Close the loop with respondents. Data shows response rates increase 4-6% when customers see “You said X, we did Y” communications.
Best Practices for Customer Satisfaction Survey Templates
Small details compound into big differences. These practices separate useful surveys from ignored ones.
Survey Timing
Post-purchase surveys: 3-7 days after delivery works best for most products. Research from PowerReviews shows this window captures peak engagement before memory decay sets in. Response rates drop 60-70% after two weeks according to Yotpo’s 2024 data.
Support surveys: Send within 24 hours of resolution. Event Marketing Institute’s 2024 study found feedback collected within 2 hours scores 40% higher on actionability than delayed surveys. Timing while the experience remains fresh delivers more accurate data.
Delivery timing: Tuesday through Thursday between 9 AM and 12 PM shows highest engagement. GetResponse data reveals 21.73% open rates at 10 AM. Avoid weekends when people prioritize leisure over surveys.
Follow-up reminders: Send 3-7 days after initial invite. A single reminder boosts response rates by 14% according to Pointerpro.
Question Wording
Neutral phrasing prevents bias. “How satisfied were you?” beats “How great was your experience?”
Leading questions destroy data quality. Research from Kapiche shows asking “How satisfied are you with our exceptional service?” influences responses differently than neutral “How satisfied are you with our service?”
Wording guidelines:
- Avoid emotionally charged terms
- Keep questions under 20 words
- Remove company ownership language (“our product” becomes “this product”)
- Use objective language without implied answers
- Test questions with 5+ people before deployment
Follow best practices for creating feedback forms to maximize response quality.
Anonymity and Privacy
Tell respondents upfront if responses are anonymous or confidential.
American Psychological Association data shows 81% of employees feel empowered to share candid opinions when surveys guarantee anonymity. Research published in TheySaid reveals this correlates with 25% higher engagement scores.
Anonymous vs. confidential:
- Anonymous: No identifiers collected, best for sensitive topics (culture, harassment, mental health)
- Confidential: Personal data collected but protected, enables segmentation and follow-up
Studies confirm anonymous surveys reduce social desirability bias and courtesy bias. Web-based surveys with complete anonymity yield more honest responses on sensitive topics than invasive methods.
Survey Frequency
Focus on avoiding survey fatigue by setting appropriate intervals:
- Relationship surveys: Once per quarter maximum
- Transactional surveys: Once per interaction
- Minimum gap: 2 months between any survey to same recipient
- Post-product launch: 3-5 days after new feature release
Research shows customers receiving multiple survey invitations in short succession experience fatigue and increased opt-outs.
Mobile Optimization
60% of survey responses now come from mobile devices according to 2025 data. Mobile completion rates hit 85% when properly optimized.
Mobile requirements:
- Test on actual devices, not just desktop browsers
- Touch-friendly buttons minimum 44×44 pixels
- Eliminate horizontal scrolling
- Minimize vertical scrolling
- Keep surveys under 5 minutes
SurveyMonkey data shows mobile completion rates increased from 52% in 2020 to 57.2% in 2023. In-app mobile surveys achieve 36.14% response rates versus 26.48% for web apps according to Refiner’s 2025 research.
Central modal pop-ups deliver 42.6% response rates. Top-center placement hits 47.8%. Bottom-corner placements get lowest engagement.
Accessibility Compliance
Implement form accessibility for screen readers:
- Clear heading hierarchy
- Proper label associations
- Keyboard navigation
- Color contrast ratios meeting WCAG standards
- Alt text for images
- Error messaging that announces via screen readers
Form Validation
Apply proper form validation to catch errors before submission:
- Real-time validation as users complete fields
- Clear error messages explaining what’s wrong
- Visual indicators showing required fields
- Format validation (email, phone numbers)
- Character limits with counters
Incentives
Use incentives strategically. They can increase response rates 20-30% but may skew data quality.
When to use incentives:
- Low historical response rates (under 15%)
- Longer surveys (10+ questions)
- Hard-to-reach audiences
- B2B surveys where time is premium
When to avoid:
- Highly engaged audiences
- Short pulse surveys (1-3 questions)
- When seeking unbiased feedback
- Anonymous surveys where you can’t deliver rewards
Research shows small upfront rewards ($1) work better than large promises after completion. Money increases responses 19% versus 8% for non-monetary rewards.
Reducing Form Abandonment
Apply strategies for improving form abandonment rate:
- Progress indicators increase completion 43% according to Reform
- Auto-save functionality reduces abandonment
- Multi-step forms for 10+ questions (86% higher conversion than single-step per IvyForms)
- Display estimated completion time upfront
- Keep total time under 7 minutes
Surveys taking 5 minutes or less see 20% higher completion rates per SurveyMonkey research. Those exceeding 12 minutes experience significant dropout.
Customer Satisfaction Survey Template Tools and Platforms
Tool choice depends on budget, integration needs, and survey complexity. The survey software market reached $4.52 billion in 2025 and projects to hit $8.55 billion by 2030 according to Mordor Intelligence.
General-Purpose Platforms
SurveyMonkey dominates mid-market with $313.3 million revenue and 20,000+ G2 reviews (4.4/5 rating). Symphony Technology Group acquired parent company Momentive for $1.5 billion in 2024.
Strengths:
- 500+ templates for quick starts
- Branching logic and A/B testing
- Integrates with 100+ business applications
- Easy for non-technical teams
Pricing: Free plan (10 questions, 100 responses). Paid plans start $25/user/month (Team Advantage). Individual plans from $99/month.
Limitations: Customer service limited on lower tiers, no phone support for most plans.
Typeform excels at conversational design with 47.3% average completion rate versus 21.5% industry average. Revenue hit $141.1 million in 2024, up 41% year-over-year.
Strengths:
- Forms with images/video see 120.6% higher completion rates
- One-question-at-a-time format reduces cognitive load
- 150,000+ customers, 500 million responses annually
- Forms under 6 questions get highest response rates
Pricing: Free plan (10 responses/month). Paid from $25/month (Basic) to $83/month per 5 users (Business).
Limitations: Limited advanced logic compared to enterprise tools, slower editor with complex multi-step forms.
Google Forms costs nothing. Basic features, limited customization, no advanced reporting. Works for internal surveys or small businesses starting out.
Qualtrics serves enterprise needs with $1.4 billion revenue. Silver Lake acquired for $12.5 billion. Serves 13,000+ brands globally, processed 1 billion+ survey responses.
Strengths:
- Complex branching and custom scripting
- Predictive analytics and AI features
- Advanced data analysis and metadata management
- Extensive customization options
Pricing: Not publicly disclosed. Basic plans start approximately $1,500/year. Enterprise pricing often $20,000+/year. Custom quotes required.
Limitations: Steep learning curve, text-heavy UI, overwhelming for beginners. QuestionPro research shows institutions quoted over $50,000 just for support packages.
Experience Management Platforms
Medallia and InMoment (which acquired Wootric) focus on experience management beyond surveys. InMoment offers integrated VoC platform combining NPS collection with text analytics, social listening, and customer journey mapping.
InMoment features:
- Multi-channel surveys (web, email, SMS, in-app, QR codes)
- NPS, CSAT, and CES measurement
- AI-powered Engagement Engine for real-time customer conversations
- Multi-language support
Pricing: Not publicly disclosed, contact for quote.
Specialized NPS Tools
Delighted (now owned by Qualtrics) streamlines loyalty measurement.
Pricing: Starter plan $17/month (100 responses annually). Premium $224/month, Premium Plus $449/month.
Features:
- NPS, CSAT, CES surveys plus 5-star, emoji, thumbs ratings
- Email, web, SMS, QR link channels
- iOS SDK for Apple developers
- Smart Trends AI for keyword identification
- Industry benchmark comparisons
AskNicely focuses on frontline teams with real-time feedback integration to MS Teams, Slack, and CRMs.
Pricing: Starter plan $49/month for 500 surveys. Standard and Advanced plans require custom quotes.
Features:
- Daily NPS tracking
- Automatic CRM integration
- Service-driven team focus
- Real-time alerts to frontline staff
Wootric (now part of InMoment) offers multi-channel feedback collection.
Pricing: Free plan available. Essential and Pro tiers require custom quotes.
Limitations: Visual customization requires CSS skills. Cheapest plan tracks only one metric (NPS, CES, or CSAT).
WordPress Integration
For WordPress sites, learning how to create a survey form with native plugins often beats external tools for simple needs. Eliminates data transfer, maintains site consistency, reduces costs.
CRM-Integrated Solutions
Salesforce, HubSpot, and Zendesk offer built-in survey features connecting feedback directly to customer records.
Benefits:
- Automatic data sync to customer profiles
- Triggered surveys based on customer behavior
- Unified reporting across touchpoints
- No separate login required for teams
Drawbacks:
- Less specialized than dedicated survey platforms
- Limited advanced survey logic
- Customization requires platform expertise
SurveyMonkey integrates with Salesforce, HubSpot, Slack, and Mailchimp. Typeform connects to 120+ apps including Zapier, HubSpot, and Notion. Qualtrics supports extensive API integrations for enterprise ecosystems.
Selection Criteria
Small businesses (under 50 employees):
- Google Forms or SurveyMonkey free/basic plans
- Budget: $0-$100/month
- Priority: Ease of use over features
Mid-market (50-500 employees):
- Typeform for brand-conscious B2C
- SurveyMonkey for general purpose
- Budget: $100-$500/month
- Priority: Balance features and usability
Enterprise (500+ employees):
- Qualtrics for complex requirements
- InMoment/Medallia for comprehensive CX programs
- Budget: $20,000+/year
- Priority: Advanced analytics, integrations, support
NPS-focused programs:
- Delighted for ease of use
- AskNicely for frontline teams
- Budget: $17-$500/month
- Priority: Quick deployment, actionable insights
Research from Mordor Intelligence shows cloud deployment holds 80.2% market share with 15.5% growth trajectory. Individual/freemium segment forecast to grow at 16.6% CAGR through 2030, fastest of all categories.
Common Mistakes in Customer Satisfaction Surveys
Mistakes waste responses and mislead decisions. Avoid these.
Leading questions bias results. “How much did you love our service?” assumes a positive experience. Use neutral framing.
Double-barreled questions confuse respondents. “How satisfied are you with our product quality and customer service?” Ask one thing at a time.
Survey length kills completion. Every question beyond 10 drops response rates. Cut ruthlessly.
Poor timing skews feedback. Sending satisfaction surveys during an outage or after a known issue captures frustration, not baseline sentiment.
No follow-up action destroys trust. Customers who give feedback expect changes. Close the loop or stop asking.
Other frequent errors:
- Ignoring negative feedback instead of investigating root causes
- Surveying too frequently (monthly NPS surveys annoy customers)
- Not segmenting results by customer type or journey stage
- Using jargon or internal terminology customers don’t understand
- Failing to test surveys on mobile devices before launch
- Skipping mobile forms optimization when 60%+ of responses come from phones
The worst mistake? Collecting satisfaction data without connecting it to business decisions. Surveys exist to drive improvement, not fill dashboards.
FAQ on Customer Satisfaction Survey Templates
What is the best survey length for customer satisfaction?
Keep surveys under 5 minutes or 10-12 questions maximum. Completion rates drop 15-20% for every additional minute. Short surveys get more responses and better data quality than lengthy questionnaires.
How often should I send satisfaction surveys?
Relationship surveys (NPS) work best quarterly. Transactional surveys should follow each interaction within 24-48 hours. Surveying more frequently causes fatigue and tanks response rates.
What is the difference between NPS and CSAT?
Net Promoter Score measures overall loyalty and likelihood to recommend. CSAT measures satisfaction with specific interactions or touchpoints. Use NPS for relationship health; use CSAT for transaction-level feedback.
Should I offer incentives for survey completion?
Incentives boost response rates but can attract low-quality responses from people only wanting the reward. Use them sparingly for long surveys or hard-to-reach segments. Keep incentives modest.
What response rate should I aim for?
Email surveys average 10-30% response rates. SMS hits 30-45%. In-app surveys reach 20-40%. Below 10% signals problems with timing, design, or audience targeting that need fixing.
How do I write unbiased survey questions?
Use neutral language without positive or negative framing. Avoid leading phrases like “How great was…” or “Don’t you agree that…” Test questions with colleagues before launch to catch hidden bias.
Can I use the same template across different industries?
Core metrics like NPS and CSAT work universally. However, industry-specific questions improve relevance. Healthcare needs HCAHPS compliance; SaaS needs feature-specific questions. Customize templates to your context.
What tools work best for satisfaction surveys?
SurveyMonkey and Typeform suit most businesses. Qualtrics serves enterprise needs. Google Forms works for basic surveys. Delighted and Wootric specialize in NPS tracking specifically.
How do I improve low response rates?
Shorten the survey, optimize send timing, personalize subject lines, and ensure mobile responsiveness. Following web forms standards and testing on actual devices fixes most response rate problems.
What should I do with negative feedback?
Respond quickly and personally to detractors. Investigate root causes before dismissing complaints. Close the feedback loop by telling customers what changed. Negative feedback reveals improvement opportunities competitors miss.
Conclusion
The right customer satisfaction survey templates turn guesswork into actionable customer insights.
You now have the metrics: NPS for loyalty, CSAT for touchpoints, CES for effort measurement.
You have industry-specific templates, question formats, and distribution methods that actually get responses.
Tools like SurveyMonkey, Qualtrics, and Typeform handle the technical side. Your job is asking the right questions at the right time.
Start simple. Pick one template, measure one metric, act on what you learn.
Satisfaction tracking only works when it drives decisions. Every survey response represents a customer telling you how to keep their business.
Listen to them. The companies that measure customer loyalty systematically outperform those that don’t.