
Most WordPress sites reach for a plugin the moment they need a contact form. It works, but it is not the only way. You can create forms in WordPress without…
Table of contents
Most survey forms fail before a single response comes in. The questions are vague, the form is too long, or the whole thing looks like it was thrown together in five minutes. And the data reflects that.
Learning how to create a survey form that actually produces usable results takes more than picking a tool and writing questions. You need a clear goal, the right question types, a logical structure, and a distribution plan that puts the form in front of the right people.
This guide covers the full process, from defining your survey objective and writing unbiased questions to choosing between tools like Google Forms, SurveyMonkey, and Typeform, building with skip logic, and analyzing your response data with cross-tabulation.
How to Define the Goal of Your Survey
One survey. One goal. That’s the rule, and most people break it.
I’ve seen plenty of forms that try to measure customer satisfaction AND collect product feedback AND gauge brand awareness, all in the same questionnaire. The result? Messy data, confused respondents, and a completion rate that falls off a cliff after question six.
Before you open any form builder tool, write down one research question. Not three. One.
Why a Single Objective Produces Better Data
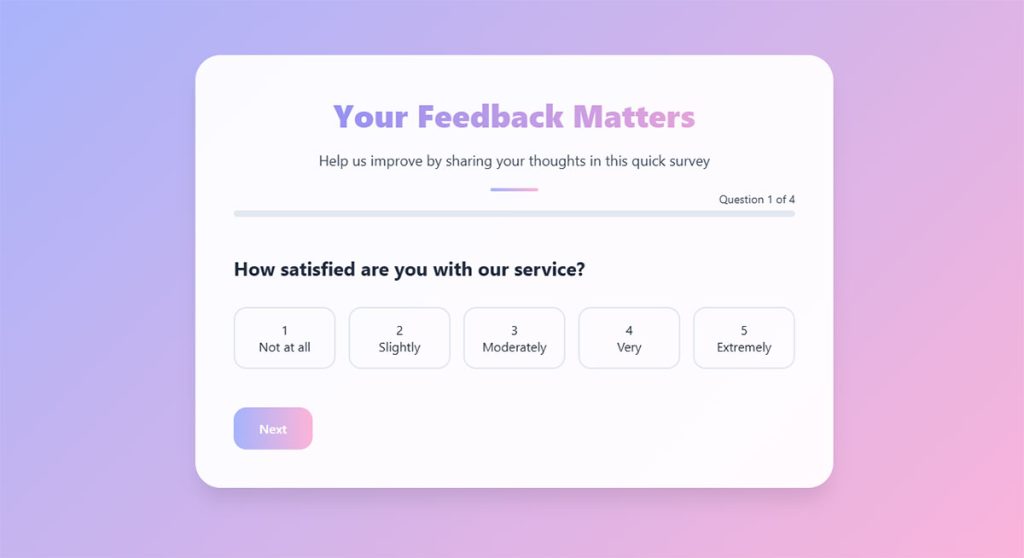
Mixed objectives dilute everything. When you combine “How satisfied are you with our service?” alongside “Which new feature do you want next?”, the respondent’s mindset shifts between evaluation and ideation. Those are different cognitive tasks.
A focused survey keeps the respondent in one mental mode throughout. That’s what drives higher response rates and cleaner answers.
Blitzllama data shows B2B survey response rates sit between 23-32%, while B2C surveys land at 13-16%. Those numbers drop fast when surveys try to serve too many masters at once.
Framing Your Goal as a Research Question
“What feature do users want next?” is a very different survey than “How satisfied are customers with our support team?”
The first one calls for ranking questions, open-ended text fields, and maybe a matrix question. The second needs Likert scale questions and a net promoter score block. Same tool, completely different design.
Good research questions are specific and answerable:
- “What is our employee satisfaction score for Q2 compared to Q1?”
- “Which onboarding step causes the most friction for new users?”
- “How likely are attendees to recommend our conference to a colleague?”
Vague goals like “understand our customers better” don’t work. They produce surveys with 30 questions and a 5% completion rate. Your mileage may vary, but in my experience, a tight research question keeps you under 10 questions, which is where avoiding survey fatigue starts.
Types of Survey Questions and When to Use Each
The question format you pick determines what kind of data you get back. Pick wrong, and you’ll spend hours trying to make sense of responses that don’t line up with what you actually needed.
Here’s the breakdown of the most common types of survey questions.
| Question Type | Best For | Watch Out For |
|---|---|---|
| Multiple choice (single select) | Quick, quantifiable answers | Missing answer options frustrate respondents |
| Multiple choice (multi-select) | Identifying preferences across several options | Too many choices cause decision fatigue |
| Likert scale | Measuring attitudes or satisfaction | Acquiescence bias (people tend to lean toward “agree”) |
| Rating scale | Quantified opinions (1–5 or 1–10) | Respondents avoid extreme ends |
| Open-ended | Rich qualitative detail | Hard to analyze at scale |
| Ranking | Prioritizing items | Breaks down when there are 7+ options |
| Matrix/grid | Rating multiple items on the same criteria | Straight-lining (same answer down the column) |
Closed-Ended vs. Open-Ended Questions
Closed-ended questions give you numbers. Open-ended questions give you stories. You need both, but not in equal parts.
Most experienced survey designers stick to roughly an 80/20 split. That means 80% closed-ended (multiple choice, rating scale, Likert) and 20% open-ended (text fields). The ratio keeps your survey fast to complete while still capturing qualitative context.
A 2022 meta-analysis published in the International Journal of Educational Research found that online surveys with smaller sample sizes (under 100) achieved a 72.7% mean response rate, while surveys sent to groups larger than 2,500 dropped to 20.3%. Longer surveys filled with open text boxes push respondents away faster, especially at scale.
There’s a real tradeoff here. Open-ended questions produce richer answers but tank your completion rate if you use too many. One or two open-ended questions per survey form, placed near the end, is usually the sweet spot.
How to Write Clear Survey Questions
Bad questions produce bad data. Doesn’t matter how polished your form design is or which online survey builder you’re using. If the question is confusing or biased, the response is useless.
The NIH published a catalog identifying 48 distinct types of bias in questionnaire design. Forty-eight. That should tell you how easy it is to accidentally influence a respondent’s answer.
Avoid Double-Barreled Questions
A double-barreled question asks two things at once and only gives room for one answer.
Bad: “How satisfied are you with our product quality and customer support?”
Better: Split it into two separate questions. One about product quality. One about support.
When a respondent loves your product but had a terrible support experience, they don’t know which part to rate. The data becomes unreadable.
Write Neutral, Specific Questions
Leading questions are a bigger problem than most people realize. SurveyMonkey’s own bias research points out that questions like “Don’t you think our product is the best?” push respondents toward agreement regardless of their true opinion.
Neutral phrasing rules:
- Replace “How much do you agree…” with “How do you feel about the following statement…”
- Cut loaded adjectives. Don’t write “our excellent range of products”
- Avoid extreme words like “always” or “never”
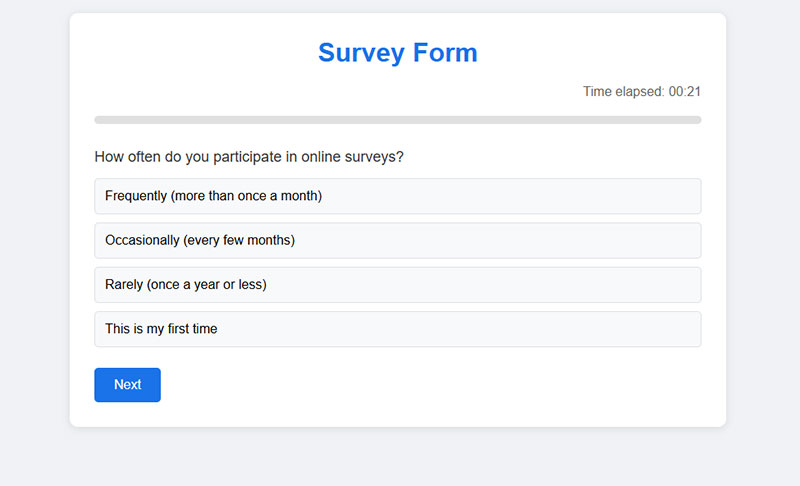
“How often do you use our mobile app?” works far better than “Do you frequently use our mobile app?” The first version collects measurable frequency data. The second is vague and pushes toward a yes.
Kantar research highlights that neutral wording is one of the most effective ways to reduce leading question bias. It sounds obvious, but I’ve reviewed dozens of feedback survey questions from real companies that break this rule in almost every question.
How to Structure and Order a Survey Form

Question order affects responses. This isn’t a guess. It’s well documented.
The NIH bias catalog classifies question order as its own distinct source of bias. Respondents anchor their answers to what they’ve already seen. Put a sensitive demographic question first, and you’ll see drop-off before they reach the second page.
Start Easy, End Personal
Opening questions should require zero thought. Simple multiple choice. Binary yes/no. Something the respondent can answer in under three seconds.
This builds momentum. Once someone answers two or three easy questions, they’re much more likely to stick around for the rest.
Save demographic survey questions (age, income, location, job title) for the very end. People are more willing to share personal details after they’ve already invested time in the survey.
Group Related Questions into Sections
Don’t jump between topics. If you’re asking about product features, keep all product questions together. If you’re asking about support experience, group those questions under a labeled section header.
Labeled sections reduce cognitive load. The respondent always knows where they are in the survey and what category of questions they’re answering.
A progress bar helps here too. SurveySparrow data shows that progress indicators placed at the bottom of the screen (not the top, where they distract) improve completion rates. It’s a small detail, but the kind of thing that separates a 40% completion rate from a 25% one.
Move from General to Specific
Broad questions first, detailed ones later. This follows a natural thinking pattern and prevents anchoring bias.
Ask “How would you rate your overall experience?” before asking “How would you rate the checkout process specifically?” If you flip the order, the checkout rating contaminates the overall impression.
Quantilope’s bias research recommends starting with broad questions and then narrowing focus. They also suggest randomizing answer options where possible to prevent order effects from skewing results.
Best Tools to Build a Survey Form
The tool you pick depends on your budget, your audience, and what you plan to do with the data. There’s no “best” option that works for every scenario, though plenty of blog posts will try to convince you otherwise.
Here’s what actually matters.
| Tool | Price | Best For | Biggest Limitation |
|---|---|---|---|
| Google Forms | Free | Simple surveys, education, quick polls | No logic branching on free tier, limited design |
| SurveyMonkey | Free tier + paid from ~$25/mo | Business research, analytics, benchmarking | Free plan is very restricted (25 responses) |
| Typeform | Free tier + paid from ~$25/mo | UX-focused forms, lead generation, engagement | Advanced features locked behind higher tiers |
| Microsoft Forms | Free with Microsoft 365 | Teams already in the Microsoft ecosystem | Fewer third-party integrations |
| Jotform | Free tier + paid from ~$34/mo | Drag-and-drop building, template library | Submission limits on free plan |
| Tally | Free tier + paid from ~$29/mo | Notion-like interface, simple forms | Smaller feature set than established tools |
Google Forms dominates with about 48% market share in the survey software category, according to 6sense. Over 593,000 companies use it. That number makes sense: it’s free, it integrates directly with Google Sheets, and anyone with a Google account can start building in under a minute.
But free has limits. If you need conditional logic, branded design, or advanced analytics, you’ll outgrow Google Forms fast.
Typeform takes a different approach. It shows one question at a time in a conversational format. Their internal data suggests average completion rates of around 47%, compared to a typical industry average of about 21.5%. That’s a real number, and it comes from the way the interface reduces visual overwhelm.
SurveyMonkey is the older player. Founded in 1999, with over 60 million users globally. Its strength is analytics. Cross-tabulation, filters, trend tracking. If you’re running quarterly employee satisfaction surveys or customer service survey questions, SurveyMonkey’s reporting dashboard does heavy lifting.
Qualtrics sits at the enterprise end. Academic institutions and large corporations use it for complex research designs. It’s overkill for a 5-question customer feedback survey, but perfect if you need nested logic, quotas, and panel management.
Free vs. Paid Survey Tools
The free tier gets you further than you’d expect on most platforms. Google Forms is entirely free with no response caps. Tally’s free plan is surprisingly generous. Jotform lets you collect up to 100 monthly submissions before asking for money.
Where free falls short:
- Logic branching: Most free tiers restrict skip logic and conditional paths
- Response limits: SurveyMonkey caps free accounts at 25 responses per survey
- Branding: Free plans display the tool’s logo on your survey
- Analytics: Basic charts only, no cross-tabulation or filtering
If you’re running surveys for a WordPress site, consider dedicated WordPress survey plugins that integrate directly with your CMS. They let you embed forms natively without relying on external tools, and many handle form validation and data storage on your own server.
For most small businesses and freelancers, a free tool covers the basics. Upgrade when you hit a wall, not before. At least in my experience, the “right” time to pay for a survey tool is when you’re running more than two surveys a month or when you need to segment responses across demographic groups.
How to Build a Survey Form Step by Step
You’ve picked a tool. You know your goal. Your questions are written. Now it’s time to actually build the thing.
Most online survey builders follow a similar workflow, whether you’re using Google Forms, Typeform, Jotform, or something else. The steps below apply broadly.
The build process in order:
- Start with a template or blank form (templates save time if one matches your use case)
- Add your questions, one field at a time, in the order you planned during the structuring phase
- Set each question’s type: multiple choice, rating scale, open-ended text, matrix
- Configure which questions are required and which are optional
- Customize the design with your brand colors, logo, and fonts
- Preview the form on both desktop and mobile before publishing
Most platforms offer a drag-and-drop interface at this point. You won’t need to write code. If you’re building for WordPress specifically, you can skip standalone tools entirely and create forms natively through WordPress forms that connect directly to your site’s database.
Amazon runs post-purchase surveys embedded right into order confirmation emails. Took me a while to notice they’re surveys at all, because the form design blends so cleanly into the email layout. That’s a sign of a well-built survey form.
Adding Logic and Branching
Skip logic (also called conditional logic in form builders) lets you show or hide questions based on previous answers.
How it works: A respondent answers “No” to “Have you used our product?” and the form skips the five product experience questions, jumping straight to a general awareness section.
This keeps surveys short for people who don’t need every question. SurveySparrow data shows that surveys longer than 9 minutes on mobile see major drop-off in respondent engagement.
Embedding a Survey Form on a Website
Three options here, and the right one depends on how you want the form to appear.
| Embed Method | How It Works | Best For |
|---|---|---|
| Inline embed | Form loads inside the page content | Dedicated survey pages, blog posts |
| Popup / modal | Form appears as an overlay triggered by click or timer | Exit intent, post-purchase prompts |
| Link redirect | Button sends user to a hosted survey URL | Email campaigns, social media shares |
SurveySparrow reports that central modal pop-ups achieve a 39.9% completion rate, the highest among placement options. Corner placements get the least engagement.
If you’re on WordPress, Squarespace, or Wix, most survey tools generate a simple embed code you paste into a page. On WordPress, dedicated free form plugins let you build and embed surveys without leaving your dashboard at all.
How to Distribute a Survey Form
A well-designed survey that nobody sees is just a form sitting on a server.
The distribution channel you choose has a direct effect on who responds and how many responses you collect. SMS surveys get 98% open rates compared to roughly 20% for email, according to Qualtrics. But email still dominates because it offers better targeting and personalization.
The right channel depends on your audience.
| Channel | Response Rate | Best Use Case |
|---|---|---|
| 10–30% | Known audiences, recurring surveys | |
| SMS | 40–60% | Quick NPS or CSAT questions |
| In-app | 26–36% | Product feedback from active users |
| QR code | 15–30% scan rate | Events, physical locations, receipts |
| Social media | Varies widely | Brand awareness, quick polls |
A restaurant chain tested this directly. Email surveys got them 8% response. They switched to SMS sent two hours after a visit and hit 52%, per SurveySparrow case data. A post-event survey sent within 24 hours while experience is fresh gets 40% higher response rates than surveys sent a week later.
Timing and Reminders
When you send matters as much as where. Consumer surveys get about 10% more responses when sent on Mondays, according to SurveySparrow research. Best times: before 10 AM and between 2-3 PM.
Send one reminder to non-responders 48 hours after the initial invitation. A second reminder rarely helps and starts to feel pushy.
For event-specific surveys (like post-event survey questions), the Event Marketing Institute’s 2024 study found that feedback collected within two hours scores 40% higher on actionability than delayed surveys. Speed matters.
How to Increase Survey Response Rates
The average survey response rate across all channels sits at roughly 33% in 2025, per SurveySparrow data. That means two out of three people ignore your survey entirely.
You can push that number up. Not with tricks, but with basic respect for the respondent’s time and attention.
Keep It Short
Blitzllama data shows the average web survey runs 10-14 minutes with 7-15 questions. That’s too long for most contexts.
Five minutes or fewer. That’s the target. If you can get your survey down to 4-5 questions, even better. Surveys past the 12-minute mark see significant drop-off, and on mobile, that threshold drops to 9 minutes.
Offer the Right Incentive
A meta-analysis of 46 randomized controlled trials, published in PLOS ONE (2023), confirmed that monetary incentives consistently boost survey response rates. Cash outperformed vouchers and lottery-style drawings.
What actually works:
- Small cash amounts (even $1-5 prepaid) beat raffle entries
- Discount codes work for existing customers
- Access to survey results motivates B2B respondents
Gallup research shows that a simple $1 prepaid cash incentive can pay for itself by reducing overall cost per completed survey, because fewer follow-up mailings are needed.
Make It Mobile-Friendly
Over 50% of survey completions now happen on mobile devices, according to Zamplia research. If your form isn’t touch-friendly, you’re losing half your audience before they answer a single question.
This means large tap targets (at least 44×44 pixels for buttons), readable font sizes, and a layout that doesn’t require horizontal scrolling. Follow solid web form best practices and test on at least two screen sizes before going live.
How to Analyze Survey Results
Collecting responses is half the job. The other half is figuring out what they actually mean.
Most survey tools come with built-in analytics dashboards. Google Forms pipes responses directly into Google Sheets. SurveyMonkey and Qualtrics offer filtering, cross-tabulation, and trend visualization right inside the platform.
Built-in Analytics vs. Spreadsheet Analysis
Built-in dashboards give you summary charts, response counts, and basic filtering. Good for quick reads. If your survey has under 200 responses, this is probably enough.
For anything larger, export your data to Google Sheets or Excel. Spreadsheets let you run formulas, pivot tables, and custom filtering that no built-in dashboard can match.
Qualtrics supports cross-tabulation analysis of up to 5 million responses natively. Most smaller tools cap out well before that.
Cross-Tabulation
Cross-tabulation compares answers from different respondent groups side by side. It’s the single most useful technique for analyzing survey data beyond surface-level totals.
Example: You survey 500 customers about product satisfaction. Overall score is 7.2 out of 10. Cross-tab by age group, and you discover customers under 30 rate you at 8.5 while customers over 50 give you a 5.8. That’s a completely different story than the aggregate number tells.
SurveyMonkey’s crosstab tool automatically highlights statistically significant differences between subgroups. Qualtrics includes chi-squared testing built in. Both save hours of manual calculation.
Turning Survey Data into Decisions
Nobody reads a 40-page data dump. When you present findings to stakeholders, keep it tight.
- Lead with the top 3 findings, not the methodology
- Include one clear recommendation per finding
- Show the data that supports each recommendation (charts over tables)
The strongest survey reports tie each finding to a specific action. “Customers rated checkout satisfaction at 4.1/10. Recommendation: simplify the checkout to three steps.” That’s how survey data turns into actual change.
Common Mistakes in Survey Form Design
Took me a while to learn some of these the hard way. But once you’ve watched a survey tank because of one avoidable mistake, you don’t forget it.
Making Every Question Required
People abandon forms the moment they feel trapped. If someone doesn’t have an opinion on a question and there’s no “skip” option, they’ll close the tab.
Only mark a question as required if you genuinely can’t analyze the survey without that answer. For everything else, leave it optional. Your form abandonment rate will thank you.
Using Jargon Your Audience Doesn’t Know
Bad: “Rate your satisfaction with our omnichannel fulfillment strategy.”
Good: “How satisfied are you with the ease of receiving your orders?”
Write for the respondent, not for your internal team. If your grandmother wouldn’t understand the question, rewrite it.
Ignoring Mobile Layout
Research.com data shows mobile users still convert at 2.2% compared to 4.3% on desktop. Part of that gap comes from forms that weren’t designed for smaller screens.
Matrix questions, long dropdown lists, and horizontal scales break on mobile. Test every question type on a phone before sending the survey out. A form UX design that works on desktop but fails on mobile isn’t a finished product.
Skipping the Preview and Test
I’ve seen surveys go out with broken skip logic, duplicate questions, and submit buttons that didn’t work. All because nobody ran through the form as a respondent before hitting publish.
Fill out your own survey. Time yourself. Click every option. Test the confirmation page. Then have someone else do the same. Five minutes of testing prevents hours of wasted responses and a confusing error message that kills trust.
Not Collecting Enough Context
Anonymous surveys have their place. But if you don’t ask at least basic segmentation questions (role, department, how long they’ve been a customer), you end up with data you can’t break down by group.
And if you can’t break it down, you can’t cross-tabulate. Which means you’re stuck with averages that hide the real patterns. Always include at least 2-3 segmentation fields, even in short surveys.
FAQ on How To Create A Survey Form
What is the best tool to create a survey form?
It depends on your needs. Google Forms is free and simple. SurveyMonkey offers stronger analytics. Typeform delivers better respondent experience with its conversational format. For WordPress sites, dedicated survey plugins let you build forms without leaving your dashboard.
How many questions should a survey form have?
Aim for 5-10 questions that can be completed in under five minutes. Longer surveys cause drop-off. On mobile devices, keep it even shorter. Every question should tie directly back to your single research goal.
What types of questions work best in a survey?
Multiple choice and Likert scale questions produce clean, quantifiable data. Use open-ended questions sparingly, roughly 20% of your total. Ranking and matrix questions work for comparisons but frustrate respondents if overused.
Can I create a survey form for free?
Yes. Google Forms is completely free with unlimited responses. Tally and Jotform also offer generous free tiers. Free plans typically limit features like skip logic, branding removal, and advanced analytics. Most small projects won’t need paid tools.
How do I avoid bias in survey questions?
Use neutral wording. Avoid leading phrases like “Don’t you agree…” and double-barreled questions that ask two things at once. Randomize answer options where possible. Test your questions with a small group before sending the full survey.
What is skip logic in a survey form?
Skip logic shows or hides questions based on previous answers. If a respondent selects “No” to a screening question, the form jumps past irrelevant follow-ups. It keeps surveys shorter and more relevant for each individual respondent.
How do I share a survey form with respondents?
Common distribution channels include email, SMS, QR codes, social media links, and website embeds. Email works best for known audiences. SMS gets higher open rates. QR codes bridge physical and digital spaces at events or retail locations.
What is a good survey response rate?
The average across all channels is around 33%. Email surveys land between 10-30%. SMS can reach 40-60%. Anything above 50% is considered strong. Response rates depend heavily on survey length, audience relationship, and incentives offered.
How do I analyze survey results?
Start with your tool’s built-in dashboard for summary charts and response counts. For deeper analysis, export data to Google Sheets or Excel. Use cross-tabulation to compare answers across demographic groups and spot patterns beyond surface-level averages.
Should I offer incentives for completing a survey?
Incentives consistently boost response rates. Research shows cash outperforms raffles and vouchers. Even a small $1-5 prepaid amount helps. For B2B audiences, offering access to the survey results themselves can be just as motivating as money.
Conclusion
Knowing how to create a survey form comes down to a few things done well. A single clear objective. Questions written without bias. A structure that respects the respondent’s time.
The tools are the easy part. Google Forms, SurveyMonkey, Typeform, Jotform. Pick one that fits your budget and audience. What separates a useful survey from a wasted one is everything that happens before you click publish.
Write neutral questions. Use rating scales and multiple choice where you need numbers. Add open-ended fields only where qualitative depth matters. Keep it under five minutes.
Distribute through the channel your audience actually uses. Analyze with cross-tabulation, not just top-line averages. And always, always test the form on mobile before sending it out.
Good survey data doesn’t come from fancy software. It comes from thoughtful design.
