






Google Analytics files plenty of visits under direct that were never direct. In a 2023 experiment by SparkToro and Really Good Data, covering 1,113 test visits across 11 networks, 100%…
Table of contents
Most customers won’t complain. They’ll just leave, or they’ll answer a short survey if you happen to ask at the right moment.
Zendesk’s 2025 CX Trends Report put a number on this: 63% of consumers say they’ll switch to a competitor after just one bad support experience. That’s up 9 percentage points year-over-year, a sharp jump for a metric that usually moves slowly.
CSAT, CES, and NPS all come from the same idea underneath. Ask one question, on purpose, right after the interaction that mattered, instead of guessing later.
A well-timed survey can turn a single annoyed ticket into an actual fix for next quarter. Left alone, it’s just a number sitting in a dashboard nobody opens.
Get the wording, timing, or question count wrong, though, and none of that happens. People just close the tab.
What Is a Customer Service Survey Question
Not the same thing as a general customer feedback survey. That one can wander into product quality, pricing, brand reputation, whatever. A customer service survey question stays narrow on purpose. It measures how someone felt about one specific support interaction, nothing broader.
CSAT, CES, and NPS cover this ground between them, and each one is asking something different even though they get lumped together constantly.
- CSAT measures satisfaction with a single interaction
- CES measures how much effort the customer had to spend
- NPS measures loyalty and willingness to recommend
You’ll see these fire right after a ticket closes, at the tail end of a live chat, or the second a phone call ends.
The American Customer Satisfaction Index (ACSI) supplies most of the cross-industry benchmark data teams lean on to judge their own CSAT numbers, and a lot of the shared vocabulary around scoring itself traces back to work done by the Customer Experience Professionals Association (CXPA).
What Types of Customer Service Survey Questions Exist
Format decides what kind of feedback lands in your inbox. A star rating gets you a fast pulse check. An open text box gets you the actual sentence explaining why the rating was a 2 and not a 5. Neither replaces the other.
| Type | Format | Best Use |
|---|---|---|
| Rating scale | Numeric, star, or emoji | Quick post-interaction pulse |
| Multiple choice | Single-select list | Categorizing the issue type |
| Open-ended | Free text | Root cause detail |
| Yes/no | Binary | Fast resolution check |
| Ranking | Ordered list | Prioritizing fixes |
What you pick should come down to what you’re actually going to act on, not what looks thorough in a monthly report. A closer look at the different formats survey questions can take shows how each structure changes the kind of data you end up with.
Closed-Ended vs Open-Ended Questions
Closed-ended questions box the answer in: a score, a star count, a yes or no. Nothing else fits. That’s exactly why they’re quick to answer and even quicker to drop into a dashboard.
Open-ended ones don’t do that. The customer just talks, in whatever words come to mind, and while that takes more effort on both ends (theirs to write, yours to read), it’s usually the only place the real explanation shows up. A rating alone can’t tell you a shipping page confused someone. A sentence can.
Quantitative vs Qualitative Question Formats
Quantitative data is the stuff you can chart. A CSAT percentage, an NPS score, an average CES rating going up or down over six months.
Qualitative is messier. Just a sentence, a complaint, sometimes a compliment that makes an agent’s week. Most working surveys don’t pick one over the other, they pair a quantitative question with a qualitative follow-up right after it. That’s the model CSAT, CES, and NPS all lean on in practice, whether the team building the survey realizes it or not.
Yes/No and Multiple Choice Questions Worth Using
Binary and single-select questions get skipped in a lot of write-ups, which is odd given they’re the fastest thing a customer can answer. A few that earn their spot:
- Was your issue fully resolved? (yes / no / partly)
- Did you have to contact us more than once about this? (yes / no)
- Did you try to solve this yourself before contacting us? (yes / no)
- Where did you look first? (help center, Google, chatbot, email, phone)
- What was your issue about? (billing, account access, shipping, product defect, something else)
- How did you reach us? (chat, email, phone, social, in-app)
- Did the agent explain what would happen next? (yes / no / not applicable)
The “contacted more than once” question is the one I’d protect if someone made me cut the survey down to two items. Repeat contact predicts churn better than a mediocre satisfaction score does.
Which Customer Satisfaction (CSAT) Questions Work Best
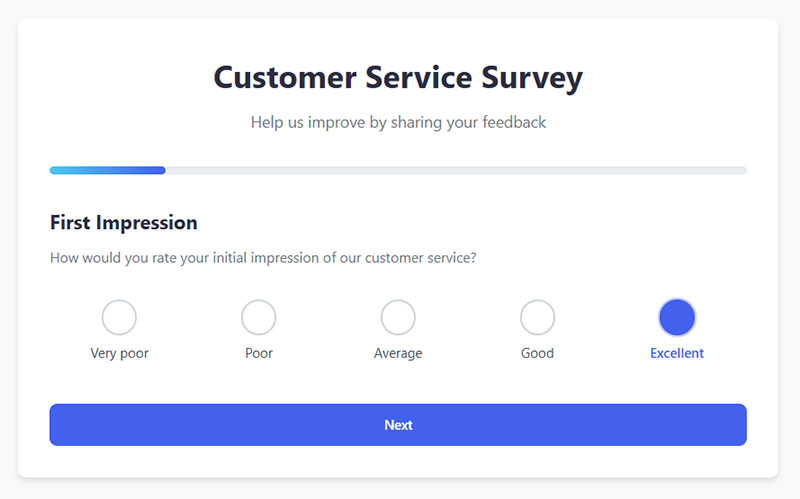
“How satisfied were you with the support you received today?” That’s the standard CSAT question, word for word, and most teams never need to stray far from it.
Anywhere from 75 to 85 percent counts as a good score across industries, based on American Customer Satisfaction Index benchmarks. Below that range and something’s probably off with either the agent training or the process itself.
A few stems get reused across most CSAT programs:
- How satisfied were you with this interaction?
- How would you rate the support you received?
- Did our agent resolve your issue to your satisfaction?
- How satisfied were you with how quickly we responded?
- How satisfied were you with the agent’s knowledge of your issue?
- How well did we keep you informed while your issue was open?
- How satisfied were you with the outcome, separate from how the conversation went?
- Would you contact us the same way again next time?
That second-to-last one splits something most CSAT questions blur together. A customer can love the agent and hate the answer. Asking about the outcome separately from the interaction tells you whether you have a service problem or a policy problem, and those get fixed by completely different people.
Scale choice matters more than most teams give it credit for. A 1-5 numeric scale is the default almost everywhere, a 1-10 scale buys more granularity for internal reporting when someone wants to slice the data further, and a smiley or emoji scale tends to lift response rates specifically on mobile and kiosk surveys, probably because it takes less thought to tap a face than pick a number.
Ready-made customer satisfaction survey templates save time when standardizing this question across every support channel, instead of reinventing wording in Zendesk, then again in the chat widget, then again on the phone script.
Zendesk, Intercom, Freshdesk, and Help Scout all run CSAT natively, right inside the ticket or chat window, firing the survey the second a case closes.
Vagaro, a beauty and wellness scheduling platform, is a decent real example of what this looks like at scale. The company pushed its CSAT to 92% after resolving 44% of incoming requests with Zendesk’s AI tools (Zendesk, 2025).
Response rates for CSAT surveys usually land in the 20 to 30% range. Anything past 40% counts as strong, and honestly, most teams never get there. The score itself is nothing fancy, just satisfied responses divided by total responses, times 100.
Which Customer Effort Score (CES) Questions Work Best
“The company made it easy for me to handle my issue.” The standard CES question isn’t phrased as a question at all. It’s a statement customers rate on a 1-7 agreement scale, from strongly disagree to strongly agree.
The format goes back further than most people assume, to a 2010 Corporate Executive Board (CEB) study, now folded into Gartner, that looked at more than 75,000 customer service interactions. The finding held up well enough that it’s still the reason CES exists as a category: 96% of customers who go through a high-effort interaction come out more disloyal, against just 9% after a low-effort one.
Worth testing a few variations beyond the default:
- How easy was it to get your issue resolved?
- How much effort did you personally have to put in to handle your request?
- Did we resolve this on first contact, or did you have to follow up?
- How many times did you have to explain your issue before it was resolved?
- Was it easy to find a way to contact us in the first place?
- How easy was it to understand the instructions we gave you?
- Did anything in the process feel like a waste of your time?
- Were you transferred or handed off to someone else? If yes, how many times?
The “explain your issue again” question is brutal in the best way. Customers count repetitions accurately, and the answer maps straight onto internal handoff problems nobody upstream would admit to.
CES tends to beat CSAT specifically in self-service scenarios and multi-step troubleshooting, situations where the process itself is under judgment, not whether the agent was friendly.
That original CEB research also found 94% of customers with a good CES score intend to repurchase, while 81% of those stuck in a high-effort experience plan to speak negatively about the company to other people.
Teams building agreement-style CES questions can borrow structure from general Likert scale question examples, since CES is really just a single-item Likert scale dropped in right after a support interaction.
Which Net Promoter Score (NPS) Questions Work Best
“How likely are you to recommend us to a friend or colleague?” Fred Reichheld introduced that exact question at Bain & Company, in a 2003 Harvard Business Review article, and it hasn’t really changed since. Support teams usually narrow it slightly: “How likely are you to recommend us based on this support experience?”
People answer on a 0-10 scale, but the raw number doesn’t mean much on its own. It’s the segmentation underneath that turns it into something usable.
| Segment | Score Range | Behavior |
|---|---|---|
| Promoters | 9-10 | Loyal, refer others |
| Passives | 7-8 | Satisfied but unenthusiastic |
| Detractors | 0-6 | At risk of churn |
Subtract the percentage of detractors from the percentage of promoters and that’s your NPS. Passives still count toward the total response pool, they just don’t factor into the score math itself, which trips people up the first time they calculate it by hand.
Transactional NPS fires immediately after a support interaction, so it’s reading one touchpoint and nothing else. Relationship NPS works on a longer clock, going out quarterly or twice a year to capture how someone feels about the whole account, including things like recent price changes that a single ticket survey would never catch.
Well-built NPS survey questions always pair that 0-10 score with a mandatory follow-up. Skip the follow-up and you’re left with a number and no idea what to do about it. Which follow-up you show should depend on the score:
| Score | Follow-up to show |
|---|---|
| 9-10 | What did we get right? Anything you’d tell a friend about? |
| 7-8 | What would have made this a 9 or 10? |
| 0-6 | What went wrong, and what would you like us to do about it? |
Detractors get one extra question worth asking outright: “Would you like someone to contact you about this?” A yes there is a recovery opportunity handed to you on a plate.
CustomerGauge research ties quarterly relationship NPS surveys to a 5.2% lift in customer retention. Bain’s own research goes further: on average, an industry’s Net Promoter leader outgrows its competitors by more than double.
What Open-Ended Questions Add the Most Value After a Support Interaction
A score by itself is basically a mystery. Attach a text follow-up and suddenly you know why. The standard pairing is simple: a CSAT, CES, or NPS score, then immediately, “What is the main reason for your score?”
Some questions are built to surface friction:
- What could we have done better?
- What was the most frustrating part of getting help?
- Was there anything unclear about how we resolved this?
- What were you trying to do when this problem started?
- What would have stopped you from needing to contact us at all?
- Where did you get stuck before you reached a person?
Others go looking for what’s actually working:
- What did the agent do well?
- What made this interaction easy?
- Is there anyone on our team you’d like us to thank?
- What would you tell someone who’s deciding whether to buy from us?
That first one in the second list, the thank-you question, is underused. It costs a customer five seconds, it gives you named recognition to pass on, and agents notice when it shows up in a weekly recap.
Keep the text field short, and make it skippable. Forcing a response on an open field almost always backfires, people type junk just to get past it rather than leave it blank.
Market research firm aytm recommends capping open-ended items at no more than one-third of a survey’s total question count, mainly to protect completion rates from tanking.
Good feedback survey questions built this way turn a raw number into something a manager can actually hand to an agent and say fix this.
Which Questions Measure Agent Performance Specifically
Team-level CSAT hides individual patterns. If you’re coaching agents, the survey needs questions pointed at behavior rather than outcome, otherwise every low score gets blamed on policy and every high score gets claimed by everyone.
- How well did the agent understand your issue? (1-5)
- Did the agent communicate clearly and without jargon? (1-5)
- How would you rate the agent’s tone throughout the conversation? (1-5)
- Did the agent take ownership of your issue rather than passing you along?
- Did the agent tell you what would happen next and when?
- Did the agent follow through on anything they promised?
- Did you feel listened to?
Separate the agent questions from the company questions in the layout. Customers instinctively soften agent ratings when they’re angry at the policy, and a clear visual split reduces that a little. Not entirely. But some.
Which Questions Work After a Complaint or Escalation
Escalated cases need their own question set. Standard CSAT wording is tone-deaf right after a refund fight, and the answers you need are different anyway.
- Do you feel your complaint was taken seriously?
- Was the outcome fair, in your view?
- How satisfied are you with how long the resolution took?
- Did we keep you updated while your case was open?
- Has this changed how likely you are to keep using us?
- Is there anything still unresolved from your side?
Notice that “was the outcome fair” is asked separately from satisfaction. A customer can accept a denied refund as fair while still rating the experience low, and knowing which one you’re looking at changes what you’d fix.
Which Questions Work After Self-Service and Chatbot Interactions
Deflected tickets never show up in CSAT, so a lot of teams have no idea whether their help center is working or quietly frustrating people into leaving.
- Did this article answer your question? (yes / no)
- What were you looking for that you didn’t find?
- How easy was it to find this page? (1-5)
- Did the chatbot understand what you were asking? (yes / partly / no)
- Did you end up needing to contact a person anyway?
- What would have made this page more useful?
The “needed a person anyway” question is the single most useful metric in self-service, and almost nobody collects it. It turns your help center from a page-views report into something you can rank by failure rate.
What Is the Ideal Number of Questions in a Customer Service Survey
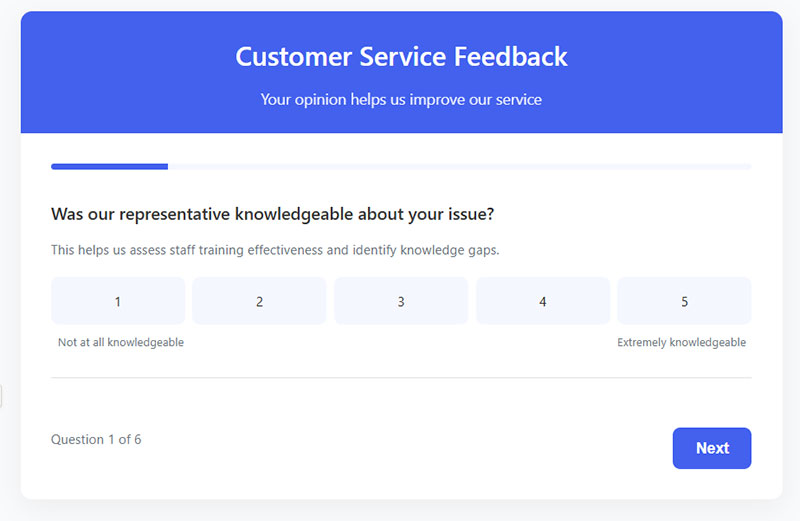
Shorter wins, consistently, across basically every dataset anyone’s published on this.
| Question Count | Completion Rate |
|---|---|
| 1-3 questions | 83.34% |
| 4-8 questions | 65.15% |
| 9-14 questions | 56.28% |
| 15+ questions | 41.94% |
Survicate pulled that breakdown from an analysis of 267,564 survey responses. SurveyMonkey’s own research points the same direction, just with softer numbers. Drawn from 100,000 surveys, a 10-question survey averages an 89% completion rate, and by the time you’re at 40 questions, that drops to 79%.
Ting Lai, voice of customer program manager at AuditBoard, put it about as plainly as anyone has. Transactional support surveys work best at two to three questions. Surveys tied to a bigger journey milestone can stretch further, to somewhere around 7 to 10, but that’s the ceiling, not a target to aim for.
Single-question surveys, usually just a CSAT or just an NPS ask, remain the safest default for anything fired right after a support ticket closes. Teams that want to add more questions without tanking completion need a plan for the drop-off first, and avoiding survey fatigue is the place that plan usually starts.
Three Question Sets You Can Copy Directly
If you want something usable without designing it yourself, these three cover most support setups.
The two-question default
- How satisfied were you with this interaction? (1-5)
- What’s the main reason for your score? (optional text)
The effort-focused set
- The company made it easy for me to handle my issue. (1-7 agreement)
- Was your issue fully resolved? (yes / no / partly)
- What slowed you down, if anything? (optional text)
The five-question milestone set
- How likely are you to recommend us based on this experience? (0-10)
- What’s the main reason for your score? (text)
- How would you rate the agent who helped you? (1-5)
- Did you have to contact us more than once about this? (yes / no)
- Anything else you want us to know? (optional text)
What Is the Best Time to Send a Customer Service Survey
Memory fades fast, and survey data backs that up almost exactly. Scorebuddy’s research on customer satisfaction surveys found immediate feedback runs 40% more accurate than feedback collected just 24 hours later, which is most of the reason transactional surveys fire within minutes of a case closing instead of sitting in an overnight batch job.
Timing shifts depending on the channel, though. A post-chat survey should hit the moment the window closes. A ticket survey has more slack, anywhere from immediately up to 24 hours after resolution still counts as fresh. A phone survey needs to run the second the call disconnects, before the customer’s already thinking about lunch. Relationship NPS is the outlier here, sent quarterly and usually timed around three months out from renewal.
CustomerGauge’s benchmarking research recommends capping it at no more than one survey per 90 days for any individual contact, to keep response quality from sliding as people get asked the same thing over and over.
The first reminder matters almost as much as the original send. It performs best somewhere in the 48 to 72 hour window after the initial invite, with a final nudge around day 7 for anyone who still hasn’t responded.
Batch sends and delayed triggers are the most common timing mistake teams make. A survey that lands a week after a ticket closes is basically asking the customer to reconstruct a memory instead of just report a reaction they’re still having.
Which Channels Work Best for Customer Service Surveys
Channel affects response rate more than question wording or visual design ever will, which surprises people who spend weeks agonizing over the exact phrasing of a single question.
| Channel | Response Rate |
|---|---|
| Popup/widget | 3.65% |
| SMS | 18.54% |
| Web link | 29.95% |
| Mobile in-app | 34.37% |
Those numbers come from SurveyMonkey’s own 2025 platform data, measured across its full customer base. Email actually scores highest of all in that same dataset, averaging 49.17%, mostly because it’s going to an opted-in list that already recognizes the sender’s name in their inbox.
Other benchmarks tell a messier story, specifically for SMS. SurveySparrow’s 2025 Mobile Engagement Report puts text-message surveys at 45 to 60%, more than double SurveyMonkey’s own average for the same channel. The gap usually comes down to how each platform defines a response. Some count any text reply at all, others require a fully completed survey, and B2B panels just behave differently than consumer SMS lists to begin with.
Live chat and in-app widgets reach people while they’re still inside the product, which cuts out the login-and-tab-switching friction that kills a lot of email response before it even starts. Screeb, a product feedback platform, reports its customers average 55% response rates on embedded surveys, with top performers reaching as high as 87%.
IVR surveys attached to phone support skip the screen entirely, just a single keypress rating right after the call disconnects, though clean industry-wide benchmarks for that particular channel are hard to come by.
Delighted, Qualtrics, and Medallia all support multi-channel deployment from a single survey program, so the same CSAT or NPS question can go out over email, SMS, and in-app without anyone rebuilding it three separate times.
What Mistakes Lower Customer Service Survey Response Rates
Leading questions push people toward a specific answer before they’ve even started typing. “How would you rate our excellent support team?” already assumes the answer, which tends to annoy anyone paying attention and skew the ones who aren’t.
Double-barreled questions are a different problem. They ask about two separate things but only leave room for one response. “How satisfied are you with our product quality and customer service?” forces a single score onto two experiences that might not even match. Someone could love the product and hate how a refund was handled, and that survey has no way to capture both.
Skype avoids this by splitting its post-support survey into separate, single-topic questions, one for audio issues, one for video issues, rather than bundling everything into one rating and hoping for the best.
A few other things quietly kill response rates:
- Vague scale labels with no clear anchor points (a bare 1 to 10 with nothing explaining what either end means)
- Surveys triggered before the interaction has actually finished
- Asking for detail the team has no real plan to act on
Weak Questions and Better Versions
| Weak question | Why it fails | Better version |
|---|---|---|
| How would you rate our excellent support team? | Leads the answer | How would you rate the support you received? (1-5) |
| Were you happy with our product quality and service? | Two things, one score | Split into one question each |
| Do you have any feedback for us? | Too open, mostly skipped | What’s one thing we could have done better? |
| Was the agent helpful? | Yes/no hides the detail | What did the agent do well, and what could have gone better? |
| Rate your experience from 1 to 10 | No anchors, everyone reads it differently | Label both ends: 1 = very difficult, 10 = very easy |
| Why didn’t you contact us sooner? | Blames the customer | Was it easy to find a way to contact us? |
Working through established best practices for creating feedback forms catches most of these before a question ever reaches a live customer.
How Are Customer Service Survey Results Analyzed and Scored
CES scoring works a little differently than CSAT or NPS. Add up every 1-7 rating, then divide by the number of responses. Land on a CES of 5.7 and that means customers leaned toward agreeing the interaction was easy, not that 57% of them were satisfied, which is a mix-up that happens more often than it should.
Closing the loop with detractors is where most of the real value in NPS data actually gets captured, more than the score itself. Best practice puts the response window within 48 hours of a detractor’s submission, since recovery rates drop sharply once a follow-up passes the 72-hour mark (Resonate CX). Programs that consistently close the loop see roughly three times more promoters in their next round of follow-up surveys than programs that just collect scores and move on (HelloCustomer).
Benchmarking against the industry adds context a raw internal score can’t give you on its own. Forrester’s 2025 CX Index analyzed more than 275,000 customer perceptions across 469 brands, spanning 12 industries and 13 countries. Globally, 21% of brands declined year over year, 6% improved, and 73% stayed statistically unchanged, which says something worth sitting with: holding a score steady is itself a real result in most industries, not a failure to grow.
Zappos.com was one of only 10 brands worldwide to keep its elite ranking in that same Forrester study.
Quality assurance scorecards inside helpdesk software like Zendesk or Freshdesk usually sit right next to the CSAT dashboard, which lets a team compare an agent’s QA score against the customer’s own rating for the same ticket side by side. Good survey data analysis connects those two numbers instead of reporting them in isolation, which is where a lot of otherwise decent programs quietly fall short.
Customer Service Survey Question Examples By Support Channel
The right format changes depending on where the conversation actually happened. A question that works fine in an email feels heavy-handed inside a chat window.
Teams wanting a working starting point can browse a guide on how to build a survey form before adapting any of the examples below to their own helpdesk setup.
Live Chat and Messaging Survey Examples
A live chat survey shouldn’t outlast the patience that got the customer through the chat in the first place. Two questions is usually already pushing it.
- How satisfied were you with this chat? (1-5 scale)
- Anything we could have done better? (optional text)
- Did you get an answer, or do you still need help? (resolved / still need help)
- How long did you wait before someone replied? (under a minute, a few minutes, too long)
Intercom, Drift, and Gorgias all support this pairing as a native widget that shows up the moment the chat window closes. Real feedback form examples from live chat tools tend to keep both questions on a single screen, since a second screen is usually where most of the drop-off actually happens.
Email and Ticket Survey Examples
The subject line is almost always something plain like “How did we do?” and the body just pairs a single CSAT scale with one optional CES follow-up.
- How satisfied were you with your recent support ticket?
- How easy was it to get this resolved?
- Was the response you got clear and easy to follow?
- Did the ticket get resolved in a reasonable amount of time?
- Is there anything still open on your side?
Zendesk, Freshdesk, and Help Scout all embed this pairing directly inside the ticket closure email, so nobody has to click through to a separate form just to answer two questions. Some teams route this through Salesforce Service Cloud or HubSpot Service Hub instead, depending on which platform already owns the ticket record in the first place.
Phone and IVR Survey Examples
Phone surveys work best as a single keypress question asked automatically the moment the agent hangs up. “On a scale of 1 to 10, how likely are you to recommend us based on this call? Press the number that matches your answer.” No login, no separate app, nothing else to switch to.
If you get a second keypress, spend it on one of these:
- Press 1 if your issue was fully resolved on this call, press 2 if it wasn’t.
- Press a number from 1 to 5 to rate how easy this call was.
- Press 1 if you’d like someone to follow up with you.
Self-service and help center articles use an even lighter version of the same idea, just a “Did this article answer your question?” yes/no prompt with an optional comment box for anyone who taps no.
Social and In-App Survey Examples
Support handled over social DMs or inside a mobile app rarely gets surveyed at all, which is a gap worth closing since the interactions tend to be short and the memory is fresh.
- Did we sort this out for you? (thumbs up / thumbs down)
- How easy was it to reach us here compared to email or phone?
- Would you use this channel again for support?
- One tap: how did that go? (emoji scale)
FAQ on Customer Service Survey Questions
Should Customer Service Surveys Be Anonymous
Most transactional surveys skip anonymity, and that’s usually deliberate. Ticket-linked responses let a team actually follow up with the customer and tie the score back to a first contact resolution outcome, which is hard to do with a blank name field. Relationship NPS flips that logic. It tends to work better anonymous, since honesty ends up mattering more than being able to trace an answer back to a specific account.
Can You Combine CSAT CES and NPS in One Survey
Technically, sure. Response rates just take the hit. Satisfaction, effort, and loyalty are three separate moments, not one, and stacking all three into a single send just makes for a longer survey with no clear signal on which score to actually act on. Most teams end up picking one metric per touchpoint instead, and leave it at that.
What Is a Good NPS Score for a Support Team
Anything above zero counts as technically positive, though that’s a low bar and context matters more than hitting it. Software and B2B services often land support NPS somewhere in the 40s or 50s. Retail and telecom typically run lower, sometimes a lot lower, and that’s fine, it’s just a different game. Compare your own number against your own trend over time. A universal benchmark won’t tell you much.
How Often Should the Same Customer Be Surveyed
No fixed universal number exists here, but over-surveying is by far the more common mistake teams make. Space transactional surveys around each new interaction as it happens, and cap relationship NPS at a quarterly cadence, at most. Ask more often than that and response rate drops while survey fatigue climbs, which is basically the opposite of what anyone wants.
Can AI Write Customer Service Survey Questions
Yes. Most helpdesk platforms already suggest default wording for CSAT, CES, and NPS, so this isn’t even a new idea at this point. Drafts save time on phrasing, no argument there. Someone still needs to check the result for leading language, double-barreled phrasing, and tone that actually matches the brand, because a draft that skips that step usually reads a little off.
What Is the Difference Between Response Rate and Completion Rate
Response rate is the blunter of the two, just how many invited customers actually started the survey. Completion rate is stricter: it only counts the people who made it all the way to the last question. A survey can post a strong response rate and still lose most of those people to abandonment before it’s actually finished, which is exactly why tracking only one of these numbers gives a skewed picture.
Should You Ask Customers to Rate a Specific Agent by Name
Yes, when coaching is the actual goal. Naming the agent personalizes the ask and ties the score directly back to a QA scorecard someone can use in a one-on-one. Skip it for process-focused surveys though, where the interaction itself matters more than who happened to handle it that day.
What Is a Good CSAT Score for a Call Center Specifically
Call center CSAT tends to run a little lower than chat or email, and that’s normal, not a red flag. New York City’s 311 call center reported scores roughly between 75% and 81% from 2020 to 2024, which is a useful real-world anchor if your team is phone-heavy and wondering what normal actually looks like.
Do Incentives Improve Customer Service Survey Response Rates
They can, carefully. Small incentives lift participation, especially on longer relationship surveys where fatigue sets in fast. Overuse them, though, and it backfires. Excessive rewards tend to drive biased, rushed responses that skew CSAT and NPS data instead of actually improving it.
What Is the Ideal Word Count for a Single Survey Question
No hard cutoff exists, but shorter wins almost every time. SurveyMonkey’s own research found question word count is one of the strongest predictors of completion rate, stronger than a lot of teams expect going in. A tight, single-sentence question beats a long, qualifier-heavy one nearly across the board.
Conclusion
Pick one metric first. Most customer service survey questions fail for a boring reason, a team tries to track satisfaction, effort, and loyalty all in the same week, instead of a more interesting one like bad wording.
Run a single CSAT question on your highest-volume channel for 90 days. Resist adding a second metric until that first number actually stabilizes and someone specific owns the follow-up.
Closed-loop feedback is the real constraint most teams underestimate. A score with no owner and no deadline is just a number nobody ever acts on, sitting quietly in a dashboard.
Expect survey fatigue to show up around the third or fourth send if nothing visibly changes for the customer on the other end. That’s the signal to slow down, not to bolt on more questions.
One metric, one channel, ninety days. Everything else can wait.