





Google Analytics files plenty of visits under direct that were never direct. In a 2023 experiment by SparkToro and Really Good Data, covering 1,113 test visits across 11 networks, 100%…
Table of contents
Ask someone their income on a survey and up to one in four will just skip the question. That’s not really about income being an awkward topic. It’s usually what happens when a demographic survey question gets worded badly in the first place, the same fields researchers depend on to make every other answer in the survey mean something.
Get the age bracket wrong, leave out a gender option, or bury the income field somewhere that feels invasive, and the rest of the survey starts collecting noise instead of signal. Get it right and one questionnaire can tell you that a 22-year-old renter wants something different from what a 60-year-old homeowner wants, using the exact same set of questions for both.
None of this is really guesswork. Federal standards already exist for most of these fields. So do platform defaults. Decades of research on response rates cover most of the rest, mainly how a question gets worded and where it sits in the survey flow.
What Are Demographic Survey Questions
Age, income, gender, location, education: none of these tell you anything useful on their own. What they do is let you split a thousand survey responses into groups small enough to actually compare, twenty-somethings against retirees, renters against homeowners, one region against another. That sorting function is the whole point. Take it away and every result in a survey report is just one flat number with nothing underneath it.
Psychographic questions ask something different. They probe attitudes and values. Behavioral questions are different again, tracking what someone actually did last week or last month. A demographic question just asks who the respondent is.
You’ll find this kind of question everywhere: government censuses, market research studies, academic research, workplace and HR surveys. Each setting puts the data to a different use, but the goal underneath stays the same, sort respondents into groups worth comparing.
SurveyMonkey, Qualtrics, Google Forms, and Typeform all support this category of question, though their built-in demographic libraries are far from identical. Demographic questions are one of several categories that make up a survey’s question mix, sitting alongside opinion, behavioral, and screening types.
Why Do Surveys Use Demographic Questions
Segmentation and Cross-Tabulation
Segmentation is why these questions exist in a survey at all. Take that away and every result gets reported as one flat average, hiding whatever’s actually happening underneath it.
Cross-tabulation is the actual technique. You take one variable, say a satisfaction score, and run it against a demographic variable, say age bracket, to see whether the two move together.
Product teams do this constantly, cross-tabbing feedback by age group to catch generational differences a flat average would otherwise bury. HR teams run the same move on engagement scores, splitting by department and tenure. Market researchers do it with purchase intent against income brackets, though in practice most teams end up combining two or three demographic variables at once rather than looking at just one in isolation.
None of this works without demographic data collected up front. That’s why breaking down responses into meaningful segments starts with the questions asked, not the analysis done afterward.
Sample Weighting and Representativeness
Pew Research Center calibrates its American Trends Panel to demographic benchmarks for age, education, sex, race, ethnicity, and geography, using figures pulled from the Census Bureau’s American Community Survey (Pew Research Center, 2024).
This process, known as weighting, corrects for the fact that some groups are consistently harder to reach than others. Younger adults and people with less formal education tend to be underrepresented in raw survey samples.
Quota sampling works from the opposite direction. Instead of correcting an imbalanced sample after collection, researchers set fixed targets for each demographic segment before the survey even goes out.
Without demographic questions, none of this correction is possible. There’s no way to check whether a sample matches the population it claims to represent without the underlying respondent profile data sitting behind it.
What Personal Identity Questions Appear in Demographic Surveys
Age and Generational Cohort
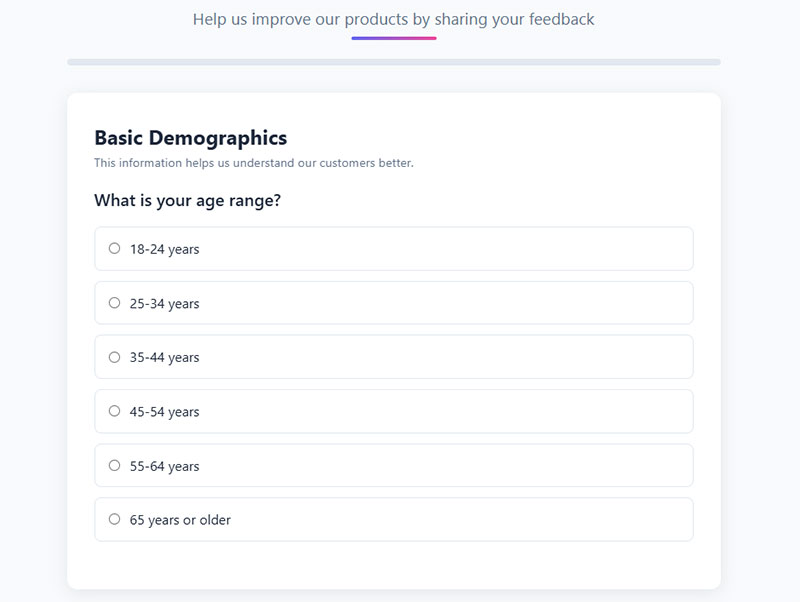
Almost every demographic section asks for age in some form, either an exact birth year or a bracketed range like 25 to 34. Most survey builders default to the bracket. It feels less exposing to answer, and it still supports generational analysis without asking for a specific year.
Three wordings that all work, depending on what the analysis needs:
- What is your age? (open numeric field)
- In what year were you born? (four-digit field)
- Which age group do you belong to? (18-24, 25-34, 35-44, 45-54, 55-64, 65-74, 75 or older, prefer not to say)
Note the brackets there. Each one ends where the next begins with no overlap, which is the single most common thing people get wrong on this field.
Pew Research Center’s generational cutoffs are the reference point most survey tools use for grouping age data into cohorts:
| Generation | Birth Years | Age in 2026 |
|---|---|---|
| Gen Z | 1997 to 2012 | 14 to 29 |
| Millennial | 1981 to 1996 | 30 to 45 |
| Gen X | 1965 to 1980 | 46 to 61 |
| Baby Boomer | 1946 to 1964 | 62 to 80 |
Pew has noted that generational boundaries are not a hard science, and it has scaled back on strict cross-generation comparisons for that reason. Even so, these ranges remain the default framework most tools use when they auto-label age brackets into cohort names.
Gender and Sexual Orientation
Pew Research Center found that 1.6% of US adults identify as transgender or nonbinary, a figure that climbs to 5% among adults ages 18 to 29 (Pew Research Center, 2022, based on a survey of 10,188 US adults).
That age skew matters for question design. A gender field with only two options undercounts a meaningful share of younger respondents specifically, which then distorts any cross-tabulation run against that variable later on.
Fixing it isn’t complicated. A usable gender question looks like this:
- What is your gender? Woman / Man / Non-binary / Prefer to self-describe (open field) / Prefer not to say
When a study genuinely needs both gender identity and sex assigned at birth (health research, mostly), ask them as two separate questions rather than folding them together:
- What sex were you assigned at birth? (male / female / prefer not to say)
- Do you describe yourself as transgender? (yes / no / prefer not to say)
Sexual orientation, when the study actually needs it:
- Which best describes your sexual orientation? Straight or heterosexual / Gay or lesbian / Bisexual / Prefer to self-describe / Prefer not to say
A prefer not to say option matters just as much here as it does on income, and it belongs on the sexual orientation field too, not only on gender.
Sexual orientation and gender identity both fall under GDPR’s special category data rules in the EU, meaning explicit consent is required before collection. Any survey targeting EU respondents needs to handle consent the way GDPR requires before asking either question.
Race and Ethnicity
The US Census Bureau follows the 1997 OMB standard, which requires a minimum of five race categories (American Indian or Alaska Native, Asian, Black or African American, Native Hawaiian or Other Pacific Islander, and White) and two ethnicity categories (Hispanic or Latino, and Not Hispanic or Latino). The ethnicity question is asked before the race question.
In practice that means two questions, in this order:
- Are you of Hispanic, Latino, or Spanish origin? Yes / No / Prefer not to say
- Which of the following best describes your race? Select all that apply. American Indian or Alaska Native / Asian / Black or African American / Native Hawaiian or Other Pacific Islander / White / Some other race (write in) / Prefer not to say
Select all that apply matters here. Forcing a single choice on race erases multiracial respondents entirely, and there are a lot of them.
The 2020 Census went further, releasing population counts for more than 200 detailed race and ethnicity groups in September 2023, made possible by new write-in fields added to the White and Black or African American categories.
| System | Categories | Applies To |
|---|---|---|
| OMB 1997 Standard | 5 race, 2 ethnicity | Census Bureau, federal surveys |
| EEOC EEO-1 Report | 7 combined categories | Employers with 100+ staff |
| OMB 2024 Revision | 7 categories, including MENA | Federal agencies, by September 2029 |
The EEOC’s EEO-1 report currently uses seven combined race and ethnicity categories, required from private employers with 100 or more workers and federal contractors with 50 or more. A 2024 revision to the OMB standard merges race and ethnicity into a single question and adds a Middle Eastern or North African category as one of the seven. Federal agencies originally had until March 2029 to adopt it, but OMB has since pushed that compliance deadline out to September 2029.
Language, Nationality, and Religion
These three come up in market research and public health work more than most demographic templates account for.
- What language do you speak most often at home?
- How well do you speak English? (very well / well / not well / not at all)
- In what country were you born?
- What is your country of residence?
- What is your religion, if any? (fixed list plus write-in plus prefer not to say)
- How important is religion in your daily life? (very / somewhat / not very / not at all)
Religion is one of the fields I’d cut unless the analysis plan actually calls for it. It’s a special category under GDPR, it depresses completion, and most surveys asking for it never use the data.
What Socioeconomic Questions Appear in Demographic Surveys
Household Income
Household income is almost always collected as a bracketed range rather than an exact dollar figure. Exact figures feel invasive to most respondents, and they produce more missing answers than a range does.
A workable US bracket set:
- Under $25,000
- $25,000 to $49,999
- $50,000 to $74,999
- $75,000 to $99,999
- $100,000 to $149,999
- $150,000 to $199,999
- $200,000 or more
- Prefer not to say
Notice the ranges end at 999 rather than the round number. That’s what keeps someone earning exactly $50,000 from having two boxes to choose from.
Related fields worth asking alongside it:
- Is that your personal income or your total household income?
- How many people does that income support?
- How would you describe your current financial situation? (comfortable / managing / struggling)
- Do you rent or own your home?
Real median household income in the US was $83,730 in 2024, not statistically different from the 2023 estimate of $82,690 (US Census Bureau, September 2025). The Census Bureau builds its own income estimates using $2,500 intervals, which is roughly the bracket width most survey tools default to as well.
Gross income and net income produce different answers to the same question, so the label on the field needs to say which one is being asked for. Leave that ambiguous and you get inconsistent data for no good reason.
Education Level
Education level questions almost always use a fixed list instead of an open text field. Open responses here are a pain to standardize later, someone writes “BA,” someone else writes “college degree,” someone else writes “Bachelors,” so most survey builders sidestep the problem entirely.
A typical list runs from less than high school up through a graduate or professional degree:
- Less than high school
- High school diploma or equivalent
- Some college, no degree
- Trade, technical, or vocational certificate
- Associate degree
- Bachelor’s degree
- Graduate or professional degree
- Prefer not to say
Two variants worth knowing. “What is the highest level of education you have completed?” is the standard. “Are you currently enrolled in school or a degree program?” is the one that catches students whose completed level understates where they are.
This field shows up constantly in workforce development research and education technology surveys. Really, any study segmenting respondents by professional background ends up needing it sooner or later.
Employment Status and Occupation
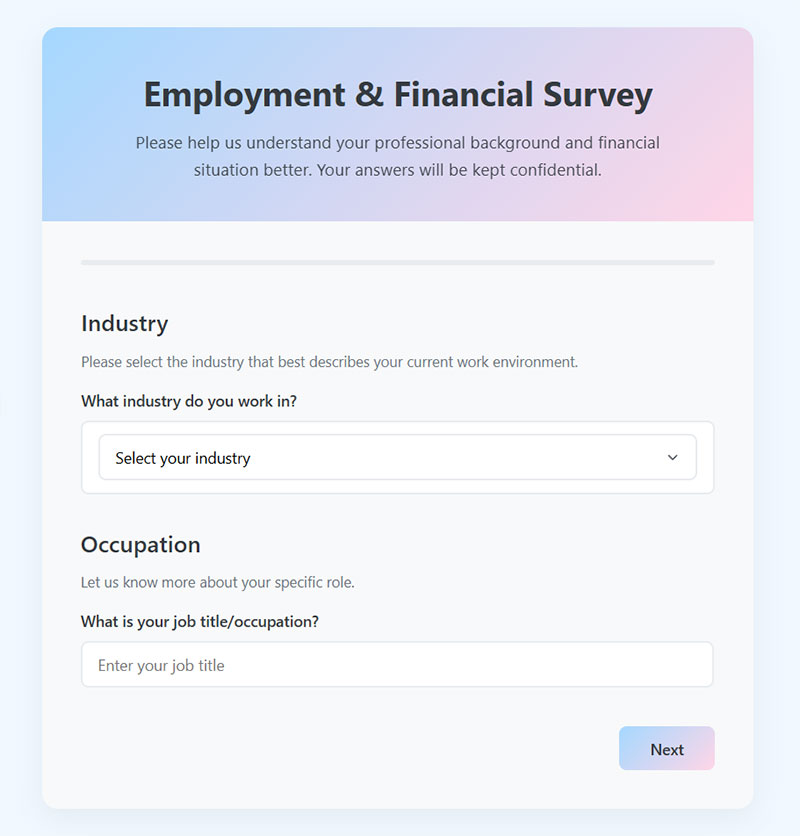
Employment status questions usually offer full-time, part-time, self-employed, unemployed, retired, and student as the core options. Disability-focused surveys tend to add a seventh choice, unable to work, on top of that list.
- What best describes your current employment status? Employed full time / Employed part time / Self-employed or freelance / Unemployed and looking / Unemployed and not looking / Retired / Student / Unable to work / Prefer not to say
- What industry do you work in? (dropdown list)
- What is your job title? (write-in)
- Which best describes your role? (individual contributor / manager / director / executive or owner)
- How many people work at your organization? (1, 2-10, 11-50, 51-200, 201-1000, 1000+)
- How many years have you worked in this field?
- Do you work primarily on site, remotely, or a mix?
Those last few belong in B2B research specifically. Company size and seniority do more segmentation work in a business survey than age and income ever will.
This field pairs naturally with income and education in socioeconomic analysis, since those three variables together explain a large share of the behavioral differences between respondents. A survey asking about employment status without also asking about income only ever gets part of the picture.
What Household and Location Questions Appear in Demographic Surveys
Marital Status and Household Size
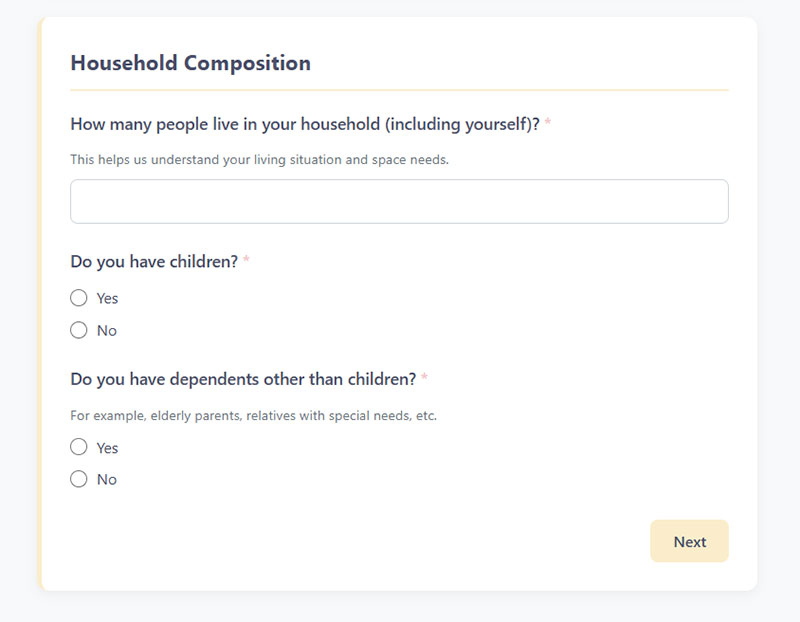
Single, married, divorced, separated, widowed, that covers most marital status questions. Domestic partnership gets added as an extra option fairly often too.
- What is your marital status? Single, never married / Married / In a domestic partnership / Separated / Divorced / Widowed / Prefer not to say
- How many people live in your household, including yourself?
- Do you have children under 18 living at home? (yes / no)
- How many, and what are their ages? (shown only if yes)
- Do you care for an adult family member or dependent?
- Do you have any pets in the household? (surprisingly useful in consumer research)
Household size is usually collected as a simple numeric field, occasionally split into total members and number of dependents under 18. Both fields matter most in surveys tied to family spending, housing, or insurance, where household composition changes what a given answer actually means.
Geographic Location
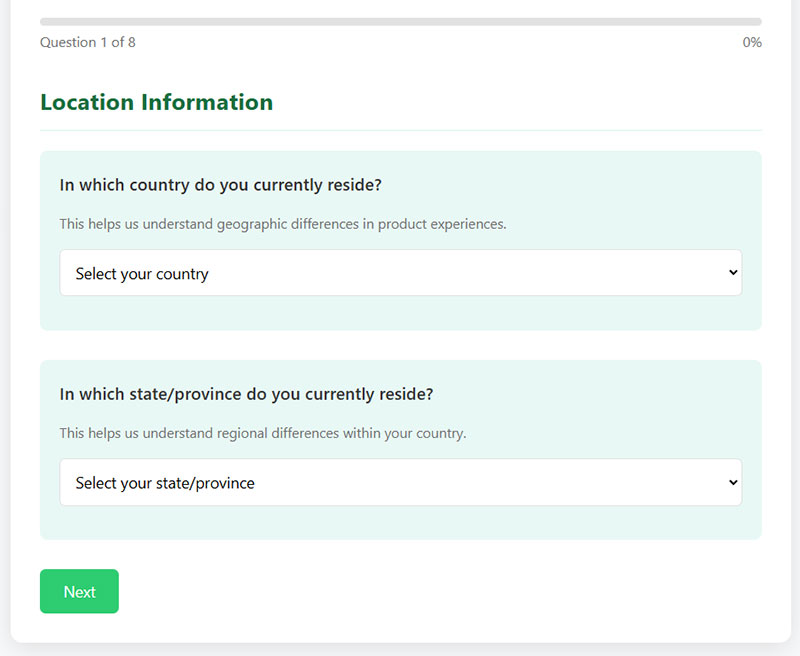
Zip or postal code is the most common geographic field, since it supports regional analysis without asking for a full street address. Location-focused studies often pair it with a broader urban, suburban, or rural classification question.
- What is your ZIP or postal code?
- What state or region do you live in? (dropdown)
- Which best describes where you live? (urban / suburban / small town / rural)
- How long have you lived at your current address?
- Do you rent or own your home?
- What type of home do you live in? (house, apartment, condo, other)
80.0% of the US population lives in an urban area, with the remaining 20.0% classified as rural, based on the Census Bureau’s housing-density criteria released after the 2020 Census. Rural, under this definition, means fewer than 5,000 residents and fewer than 2,000 housing units.
That figure doesn’t match every federal definition, though. The Economic Research Service’s nonmetro county classification puts the rural population at just 13.8%, or 46 million people, a gap of more than 20 million from the Census Bureau’s own housing-density count.
The two definitions aren’t measuring the same thing. One counts by county. The other counts by housing density. Worth knowing before comparing rural population figures pulled from different sources.
Demographic Questions for Workplace and HR Surveys
Employee surveys need a different demographic block from a consumer study. Age and income matter less. Tenure, department, and work arrangement matter a lot more, and anonymity is a live concern rather than a theoretical one.
- How long have you worked here? (under 6 months, 6-12 months, 1-3 years, 3-5 years, 5-10 years, 10+ years)
- Which department or function do you work in?
- What is your level? (individual contributor / people manager / senior leader)
- Do you manage other people? (yes / no)
- Are you full time, part time, or contract?
- Do you work on site, hybrid, or fully remote?
- Which location or office are you based in?
- Which shift do you usually work? (where relevant)
One rule matters more than all of them. Suppress reporting for any group under a threshold, usually five or ten responses. Cross-tab tenure by department by gender in a hundred-person company and you can name individual people, which is exactly what an anonymous survey promised not to do.
What Question Formats Are Used for Demographic Data
Closed-Ended vs Open-Ended Formats
Closed-ended formats dominate demographic sections because they produce data that’s easy to tabulate. Open-ended formats only show up where a fixed list would exclude too many real answers, like gender identity or an other race and ethnicity field.
In practice this splits into two working styles. Single-select radio buttons handle mutually exclusive categories like age bracket or marital status, where a respondent can only be one thing at a time. Multi-select checkboxes cover select-all-that-apply fields, race being the obvious example, since a person can reasonably claim more than one.
Write-in text fields are the open-ended half, and they’re mostly reserved for gender identity, occupation, or a genuine other option that a checkbox list couldn’t have anticipated ahead of time.
The mechanical difference between a single-select radio button and a multi-select checkbox is what determines whether a respondent can pick one answer or several, so the choice between them isn’t cosmetic.
Ranges, Brackets, and Dropdowns
Nearly every demographic format comes down to a bracketed range, a dropdown menu, or a write-in field. Long lists like country or state work better as dropdowns than as a wall of radio buttons. Nobody wants to scroll through two hundred individual buttons to find their country, and it slows completion for no real benefit.
| Format | Best For | Example |
|---|---|---|
| Bracketed range | Age, income | 25 to 34 |
| Dropdown menu | Long category lists | Country, state |
| Write-in field | Identity fields | Gender, ethnicity |
Unlike attitude questions, which often rely on a Likert scale to measure agreement or satisfaction, demographic questions almost never use one. There’s no meaningful strongly-agree version of an age bracket.
Dropdowns, brackets, and write-in options are just different field types doing the same underlying job: turning an open-ended answer into something structured enough to analyze.
Where Are Demographic Questions Placed in a Survey
End of the survey is the default placement for demographic questions, and for good reason. Leading with income or ethnicity before any rapport is built increases the odds a respondent quits before finishing.
Questions perceived as intrusive reduce both response rates and reporting accuracy, a finding that has held up consistently in sensitive-question research (Tourangeau and Yan, 2007, Psychological Bulletin). Demographic fields like income, race, and religion sit squarely in that intrusive category for a meaningful share of respondents.
Placing the demographic block at the end is one of the more effective ways to keep fatigue from building before someone reaches the finish line. It also lines up with the broader work of cutting down on the number of people who quit partway through a form.
Screener questions break this rule on purpose. When age, location, or another demographic trait determines whether someone even qualifies for the study, that question moves to the very beginning, ahead of everything else. Typical screeners:
- Are you 18 or older? (yes / no, terminate on no)
- Do you currently live in [country or region]?
- Which of these best describes your role? (terminate on ineligible answers)
- Have you purchased [category] in the past six months?
- Do you or anyone in your household work in market research, advertising, or media? (the standard industry exclusion)
A study targeting parents of school-age children needs an age-of-children screener before question one, not after question thirty.
How Are Sensitive Demographic Questions Worded
Every sensitive demographic field needs an opt-out. Income, race, religion, and other sensitive identity fields carry a real risk of nonresponse or false answers when a respondent feels cornered into picking something that doesn’t fit.
Income questions carry item nonresponse rates of 10% to 25% across household surveys, a range confirmed across multiple methodology studies (Atrostic and Kalenkoski, 2002; Moore et al., 2000). Adding a prefer not to answer or decline to state option doesn’t close that gap, but it does convert a silent drop-off into a labeled, analyzable response.
A few habits help here. Offer prefer not to answer on income, race, religion, and sexual orientation fields specifically, not just the ones that feel obviously sensitive. Word the question in neutral terms too, without phrasing that hints at a normal or expected answer.
A short preamble helps more than people expect. Something like: “These last few questions help us understand who took part. Answer only what you’re comfortable with.”
And once the responses come in, aggregate and anonymize them before they land in a report. Nobody needs to see raw, individually identifiable answers on a field like this.
Terminology drifts, and demographic wording that felt neutral a decade ago can read as exclusionary today. CDC health communication guidance recommends capitalizing racial and ethnic group names as proper nouns and using gender-neutral phrasing wherever the question allows it (CDC, 2024).
Wording that assumes a household has one income earner, or that a respondent’s gender matches their sex assigned at birth, produces bad data before the analysis even starts. None of this needs to be complicated. Write the question the way a stranger would actually answer it honestly, not the way a template assumes they will.
Weak Wording and Better Versions
| Weak version | What breaks | Better version |
|---|---|---|
| Sex: M / F | Conflates sex and gender, no opt-out | What is your gender? (with non-binary, self-describe, prefer not to say) |
| Age: 20-30, 30-40, 40-50 | Overlapping brackets | 20-29, 30-39, 40-49 |
| What is your income? | Personal or household? Gross or net? | What was your total household income before taxes last year? |
| Marital status: Single / Married | Missing several real answers | Full list plus prefer not to say |
| Race (pick one) | Erases multiracial respondents | Select all that apply |
| What is your wife’s or husband’s occupation? | Assumes marriage and gender | Does anyone else in your household work? What do they do? |
| Are you disabled? | Blunt, and not how people self-identify | Do you have a condition that limits any daily activities? (yes / no / prefer not to say) |
What Legal and Compliance Standards Apply to Demographic Questions
GDPR and EU Requirements
GDPR violations tied to special category data processing fall under the regulation’s higher enforcement tier. Article 83 sets a maximum penalty of 20 million euros or 4% of a company’s global annual turnover, whichever is higher, for breaches involving the conditions for consent under Articles 5, 6, 7, and 9 (GDPR, Article 83).
That penalty structure is why demographic sections on EU-facing surveys typically separate consent for sensitive fields, such as race, health, or sexual orientation, from consent for the rest of the questionnaire. Bundling every question under one blanket consent checkbox raises legal exposure rather than lowering it.
Data minimization applies here too. Collecting a race or religion field a survey has no analytical plan for is itself a compliance risk, independent of how the question is worded.
US-Specific Standards (EEOC, Census Bureau, CCPA)
The EEOC prefers self-identification for collecting race and ethnicity data on the EEO-1 report. Every employee has to be given the chance to self-identify first, and only if someone declines does the employer fall back to existing employment records, with visual observation reserved as a genuine last resort.
The Census Bureau works from the opposite direction. Most compliance rules mandate release of some kind. This one prohibits it. Title 13 seals individual responses for 72 years, and breaking that confidentiality carries a penalty of up to $250,000 and five years in federal prison, a heavier deterrent than most people realize sits behind a government survey.
California’s CPRA classifies race, ethnicity, religious belief, and sexual orientation as sensitive personal information, which gives consumers the right to limit how businesses use it. AB 947, effective January 1, 2024, folded citizenship and immigration status into that same protected list.
What Mistakes Reduce the Quality of Demographic Data
Overlapping brackets are the most common design error. An age question offering 25 to 35 and 35 to 45 as separate options forces anyone who’s exactly 35 to guess which bracket the researcher meant, and different respondents will guess differently.
Brackets need to be both mutually exclusive and collectively exhaustive. Every possible answer fits exactly one option, with no gaps and no overlap between choices.
Forced-choice questions with no other or non-response option create a second failure point. Making a field mandatory is a form validation decision, and validation rules that block submission without an escape hatch push respondents toward abandoning the form or entering a meaningless answer just to get past it.
A two-option gender field carries the same problem in a different shape. Respondents who don’t fit either option are forced to pick an inaccurate answer or skip the question, and either outcome corrupts whatever cross-tabulation later depends on that field.
Volume compounds all of this. SurveyMonkey’s own certified templates range from a six-question Snapshot version to an eleven-question expanded version, a reasonable proxy for how much demographic data one survey should realistically ask for in a single pass.
Stacking every demographic field a team might someday want, rather than the fields tied to a specific analysis plan, is what turns a short survey into one people quit halfway through.
A Six-Question Block You Can Copy
When there’s no specific analysis plan and you just need standard segmentation, this covers most of it:
- What is your age group? (bracketed, non-overlapping, plus prefer not to say)
- What is your gender? (woman / man / non-binary / self-describe / prefer not to say)
- What is the highest level of education you’ve completed?
- What best describes your employment status?
- What was your total household income before taxes last year? (brackets plus prefer not to say)
- What is your ZIP or postal code?
Add race and ethnicity only when the analysis genuinely uses it. Add anything else only when you can name the cross-tab it feeds.
Which Survey Tools Support Demographic Question Templates
| Tool | Demographic Question Support | Notable Feature |
|---|---|---|
| SurveyMonkey | Certified Question Bank library | OMB-aligned race and ethnicity wording |
| Qualtrics | Manual fields plus quota logic | Quotas cap responses per demographic group |
| Google Forms | No dedicated library | Basic answer-based section routing |
| Typeform | Manual fields plus branching | Logic Jumps route by demographic answer |
SurveyMonkey’s Question Bank comes with certified demographic questions already matched to current OMB race and ethnicity wording. Nobody on the team has to draft categories from scratch or guess whether a phrasing is compliant.
Qualtrics skips the prewritten set entirely. Instead there’s Quotas, a feature that caps how many responses come in from a given demographic group and can shut the survey down automatically once a quota fills, which is genuinely useful if you need exactly 200 responses from each age bracket and not 400 from one and 50 from another.
Google Forms is the thinnest option here. Its template gallery splits into Personal, Work, and Education, and none of those is actually built for demographics, so the block gets assembled field by field instead of pulled from a preset list. On a WordPress site, that job usually falls to a dedicated survey plugin instead. Teams that outgrow Google Forms tend to move to a different survey builder for more or less this reason.
Typeform goes a different route with Logic Jumps, routing respondents down different question paths depending on how they answer a prior field. Point that at demographics and an employment status answer can skip someone past follow-up questions that don’t apply to them, rather than showing every branch to every respondent.
FAQ on Demographic Survey Questions
What Is the Difference Between Demographic and Psychographic Questions
Age, income, location, that’s demographic territory, classifying who someone is. Psychographic questions go after why they act the way they do instead, digging into values, lifestyle, and motivation. Most market research surveys end up using both, since demographics split respondents into segments and psychographics explain what’s actually different between those segments.
What Is the Difference Between Race and Ethnicity in Survey Questions
Race sorts by shared physical or ancestral traits, categories like Asian, Black, or White. Ethnicity is a different axis entirely, grouping by shared culture or nationality, Hispanic or Latino being the main example in US surveys. The Census Bureau treats these as two separate questions rather than folding them into one.
How Many Demographic Questions Should a Survey Include
Three to five demographic variables covers most surveys, and ideally each one ties directly to a specific analysis plan someone actually intends to run. Every extra field beyond that adds length for no clear purpose, and it’s exactly the kind of thing that pushes someone to abandon the survey before the last question.
Are Demographic Questions Mandatory for Respondents to Answer
No. Best practice treats sensitive demographic fields, like income, race, or religion, as optional, paired with a prefer not to answer choice. Forcing a response on identity-related questions increases both survey abandonment and the odds of an inaccurate answer.
What Is an Example of a Good Demographic Survey Question
“What is your age?” with bracketed ranges (18-24, 25-34, 35-44) beats an open text field almost every time. It sidesteps the discomfort of giving an exact figure, and it standardizes responses well enough for cross-tabulation. Generational cohort analysis falls out of it too, without any extra cleanup work later.
What Demographic Data Is Illegal to Collect in a Survey
Nothing is banned everywhere, but GDPR requires explicit consent before collecting race, health, or sexual orientation data in the EU. US states individually regulate citizenship questions on public forms. Legality depends on jurisdiction and consent, not the field itself.
Is It Rude to Ask Demographic Questions in a Survey
Not when the purpose is clear and the field is optional. Respondents react negatively to demographic questions that feel irrelevant, arrive without explanation, or offer no way to decline. Context drives the discomfort, not the question itself.
What Is the Difference Between Demographic and Firmographic Data
Demographic data is about individual people, age, income, gender, location. Firmographic data shifts the lens to organizations: company size, industry, revenue, headquarters location. B2B surveys often collect firmographic data alongside standard demographic questions, sometimes instead of them entirely.
What Is the Difference Between a Census and a Demographic Survey
A census counts an entire population, and it’s mandatory and government-run, the decennial US Census being the obvious example. A demographic survey is a much smaller thing by comparison. It’s optional, it samples a fraction of the group instead of counting everyone, and it’s usually run by a business, researcher, or organization chasing its own analytical purpose.
What Happens to Data Quality When Respondents Skip a Demographic Question
Every skipped field shrinks the sample available for that cross-tabulation. If skips cluster around one group, such as older respondents avoiding income questions, the remaining data becomes skewed rather than simply smaller, and that bias is harder to detect after the fact.
Conclusion
Start smaller than feels comfortable. The strongest demographic survey questions are the ones a stakeholder could actually defend before the survey goes live, not the ones a template happened to include by default.
Build the socioeconomic and identity fields last, after the questions your analysis plan actually depends on. Test the wording on ten people before it ever reaches a thousand of them.
None of this is permanent, and it shouldn’t be treated that way. Generational cutoffs shift. EEOC categories shift. Privacy law under GDPR and CPRA moves on its own schedule too, and a bracket that read as neutral last year can look outdated, or outright noncompliant, by next year.
Treat the demographic section as a living part of the survey, something reviewed on the same cycle as the questions it’s there to explain.