





Google Analytics files plenty of visits under direct that were never direct. In a 2023 experiment by SparkToro and Really Good Data, covering 1,113 test visits across 11 networks, 100%…
Table of contents
JD Power’s Initial Quality Study puts the average new vehicle at 194 problems per 100 units sold (JD Power, 2024). Almost none of those get caught on a lab bench. They show up in a survey question, weeks or months after the car has already left the lot.
A product can pass every internal check a company runs and still fail the moment a real customer opens the box. That’s the gap between “we tested it” and “it held up,” and structured quality questions are what catches it. Specs and inspection lists don’t.
Get the wording wrong, or send the thing out at the wrong time, or pick a scale that skews toward one end, and the numbers stop meaning much. They still look like data. They just aren’t telling you anything true.
What Are Product Quality Survey Questions
Ask a customer whether they love your brand and you’ll get one kind of answer. Ask if the zipper catches, or if the battery actually lasts as long as the box claims, and you get something else. Customer Satisfaction Score (CSAT) and Net Promoter Score are built for the first kind of question, the whole relationship. A product quality question narrows down to a single trait instead.
That’s also what separates this from broader feedback survey questions, which capture reactions to an entire purchase or support interaction instead of one specific attribute of the product itself.
IDC surveyed 521 decision-makers at process and discrete manufacturers for its 2024 Product Quality and Digital Transformation study, and quality ranked as the primary driver behind product success across that group (IDC, 2024).
Formal quality frameworks run on this same data. ISO 9001 certification requires documented customer feedback loops as part of its quality management system, and Six Sigma treats the defect data pulled from these surveys as raw input for DMAIC problem solving. Total Quality Management goes further, tying survey scores directly to continuous improvement targets on the shop floor.
ISO recorded 1,249,317 certified ISO 9001 sites worldwide in 2023, making it the most widely adopted quality management standard in manufacturing (ISO Survey, 2023).
Which Product Quality Dimensions Do Survey Questions Measure
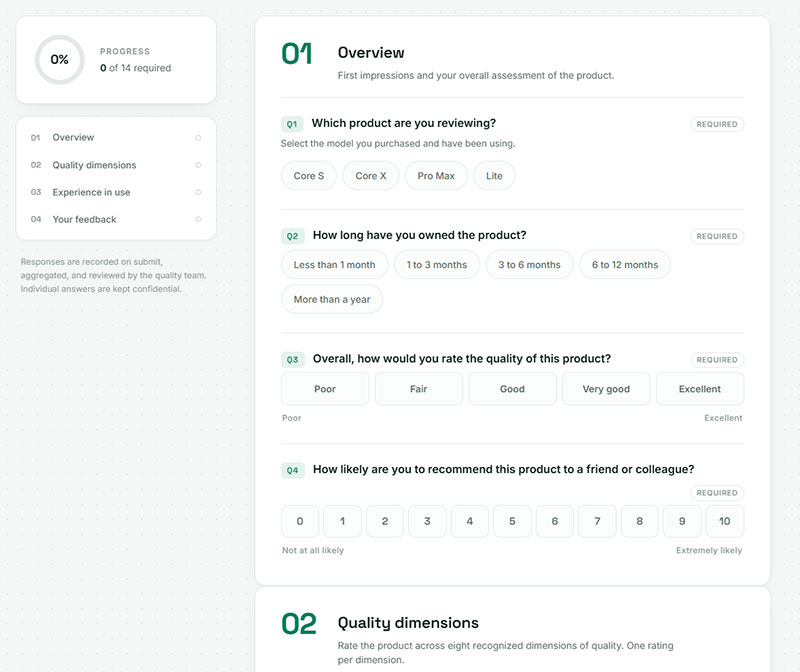
David Garvin split quality into eight dimensions in a 1987 Harvard Business Review article: performance, features, reliability, conformance, durability, serviceability, aesthetics, and perceived quality.
The paper has drawn 1,868 academic citations since, and it’s still the standard vocabulary for breaking product quality into measurable parts (Garvin, 1987; Semantic Scholar).
| Dimension Cluster | What It Measures | Sample Survey Question |
|---|---|---|
| Reliability | Failure frequency, defect rate | How often has this product stopped working as expected |
| Durability | Expected lifespan under normal use | How many years do you expect this product to last |
| Performance | Function versus advertised spec | Does the product meet the performance stated on the packaging |
| Consistency and Design | Batch uniformity, aesthetics, perceived value | Did this unit match the quality of your last purchase |
Reliability and Defect Rate Questions
JD Power’s Initial Quality Study pairs Voice of the Customer survey data with real repair records. In the 2026 cycle, Porsche posted the industry’s best score at 138 problems per 100 vehicles, based on responses collected from June 2025 through May 2026 (JD Power, 2026).
Reliability questions ask how often something fails. Not whether the customer likes it.
- How many times has this product needed repair since purchase?
- Has this product ever stopped working during normal use?
- Did anything arrive damaged, missing, or already faulty?
- How soon after purchase did the first problem appear?
- Has the same problem happened more than once?
- Did the product still work after the problem, or did it stop entirely?
- Have you had to work around a fault rather than get it fixed?
- Describe what went wrong, in your own words. (open text)
That “how soon after purchase” question is the one that separates a shipping problem from a manufacturing problem from a wear problem. Three different fixes, three different teams, and none of them show up in an average rating.
Durability and Lifespan Questions
A product that impresses on day one can still fall apart by month three. That gap, the space between unboxing and actual use, is what durability questions are built to catch.
- How long do you expect this product to last before you replace it?
- How does that compare to what you expected when you bought it?
- Have you noticed any wear, fading, cracking, or loosening after regular use?
- Which part shows wear first?
- How often do you use it? (daily, weekly, monthly, rarely)
- Has the product’s performance dropped over time, or held steady?
- Would you buy the same product again when this one wears out?
Pairing usage frequency with wear reports is what keeps the data honest. A jacket that frays after six months of daily wear is a different story from one that frays after six weekends.
Durability data usually surfaces weeks or months after purchase. Never at the point of sale.
Performance and Functionality Questions
Performance questions test a product against its own spec sheet. Nothing else.
- Does the product perform as advertised on the packaging or product page?
- Did any specific claim not hold up? Which one?
- How would you rate the product’s performance for your main use? (1-5)
- Was setup or first use straightforward?
- Is there a feature you expected that turned out to be missing?
- Is there a feature you never use?
- How does it compare to the product you used before this one?
IDC’s 2024 manufacturer survey traced poor quality most often to design and specification gaps rather than production defects (IDC, 2024).
A vacuum rated for 40 minutes of runtime either hits that number or it doesn’t, which is exactly why this dimension works better as a numeric or yes/no question than an opinion scale.
Consistency, Design, and Value Questions
- Did this unit match the quality of your previous purchase? (better / same / worse)
- If it was worse, what specifically felt different?
- How would you rate the look and feel of the product? (1-5)
- Does the product feel well made when you handle it?
- Did the product match the photos and description?
- Is the product worth what you paid? (1-5)
- What would you consider a fair price for this?
- How would you rate the packaging, both protection and presentation?
Perceived value is where the loop closes between price and quality perception, and it’s the dimension Garvin found hardest to separate from brand reputation.
Serviceability and Support Questions
Garvin listed serviceability as its own dimension, and most quality surveys skip it entirely. That’s a mistake. How a company handles a broken product shapes quality perception nearly as much as whether it broke in the first place.
- Did you contact us about a problem with this product?
- How easy was it to get the product repaired, replaced, or refunded? (1-7)
- How long did the resolution take?
- Were replacement parts available when you needed them?
- Were the instructions or documentation clear enough to solve it yourself?
- Did the fix actually resolve the problem, or did it come back?
What Question Formats Are Used to Measure Product Quality
Closed-ended scales and open text fields cover most of what shows up across the different types of survey questions used in product research.
Closed-Ended Scale Questions
| Format | Structure | Best For |
|---|---|---|
| Likert scale | 5 or 7-point agreement scale | General quality perception |
| Semantic differential | Bipolar adjective pairs | Design and brand-linked traits |
| Single-item loyalty | 0-10 recommend scale | Overall product loyalty tracking |
| Customer Effort Score | Single effort question | Usability and troubleshooting friction |
Written out, those look like:
- Likert: “This product is well made.” (strongly disagree to strongly agree)
- Likert: “The product performs the way I expected it to.”
- Semantic differential: Cheap ←→ Premium. Flimsy ←→ Sturdy. Dated ←→ Modern.
- Loyalty: “How likely are you to recommend this product to someone with a similar need?” (0-10)
- Effort: “It was easy to get this product working the way I needed.” (1-7)
Full breakdowns of Likert scale question examples and the standard NPS survey questions format cover wording and scoring in more depth.
The semantic differential format, built on bipolar pairs like poorly made versus well made, comes out of Charles Osgood, George Suci, and Percy Tannenbaum’s 1957 research on measuring meaning.
The single-item loyalty question borrows its 0-10 scale from the format Fred Reichheld introduced at Bain & Company in 2003. Two-thirds of Fortune 1000 companies run some version of it today (Bain & Company).
Open-Ended and Semi-Open Questions
Open text fields catch defects closed scales miss entirely.
A respondent might rate a product 4 out of 5 on a Likert item and still describe a cracked seam in the comment box right below it. That’s information no numeric scale picks up on its own.
Prompts that pull specifics rather than sentiment:
- Describe any problem you’ve had with this product.
- What’s the weakest part of this product?
- What would you change about how it’s built?
- What almost made you return it?
- What surprised you about it, good or bad?
- If you could tell the person who designed this one thing, what would it be?
SurveyMonkey’s 2025 platform data shows completion rates fall from 88% to 78% as a survey adds multiple open-ended questions, which is why most product quality instruments limit themselves to one open box per section (SurveyMonkey, 2025).
What Is the Difference Between B2B and B2C Product Quality Surveys
Gartner puts the average B2B buying group at 6 to 10 decision-makers, each arriving with 4 to 5 pieces of independently gathered research (Gartner, 2024).
A single quality survey sent to one buyer misses most of that group entirely.
| Factor | B2B Surveys | B2C Surveys |
|---|---|---|
| Typical respondents | Multiple stakeholders per account | Single buyer or end user |
| Question length | 10 to 20 questions, segmented by role | Under 5 questions |
| Primary weighting | Reliability, total cost of ownership | Design, ease of use, emotional fit |
What Changes in B2B Product Quality Surveys
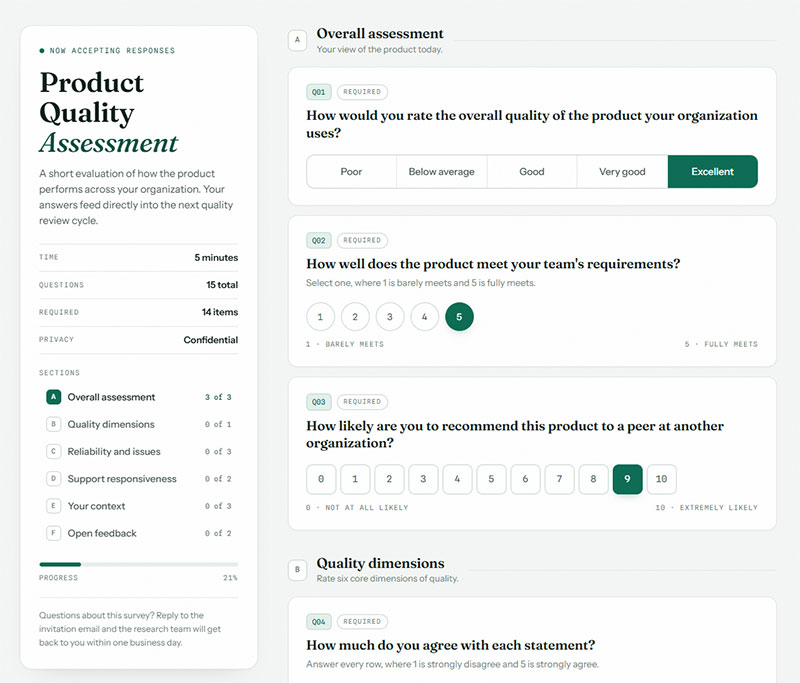
B2B quality programs rarely settle for one voice speaking for the whole account. Programs that get this right survey the end user, the technical evaluator, and procurement separately, since whoever signs the purchase order often never touches the product at all.
- Reliability and total cost of ownership outweigh aesthetics in question weighting
- Technical specification conformance gets its own dedicated question block
Questions worth splitting by role:
| Role | Question to ask them |
|---|---|
| End user | Does the product do what you need it to, day to day? |
| End user | How often does it interrupt your work? |
| Technical evaluator | Does it meet the specifications you were given? |
| Technical evaluator | How does it perform under peak load or heavy use? |
| Maintenance | How easy is it to service, and are parts available? |
| Procurement | How does total cost of ownership compare to what you projected? |
| Procurement | Would you approve this vendor again? |
A few more that cut across roles:
- Has downtime from this product affected your output? Roughly how much?
- How consistent is quality across the units or batches you’ve received?
- Was documentation and training adequate for your team?
- How does this compare to the vendor you used before?
What Changes in B2C Product Quality Surveys
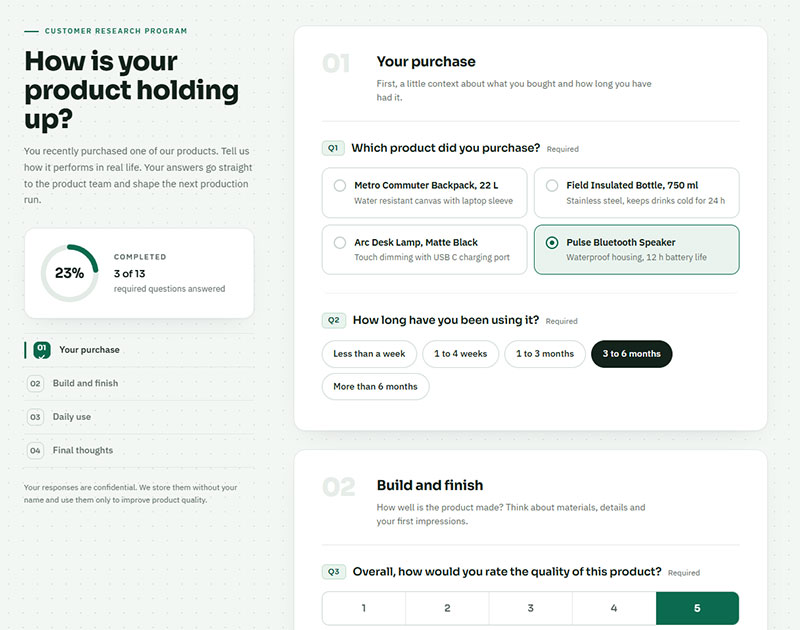
SurveyMonkey’s 2025 platform data shows a 10-question survey completes at 89% versus 79% for a 40-question version, a gap that pushes B2C teams toward shorter instruments (SurveyMonkey, 2025).
Most B2C product quality surveys stay under 5 questions for exactly this reason. A workable five:
- How would you rate the quality of this product? (1-5)
- Did it arrive in good condition and work as expected? (yes / no)
- Does it match how it was described online? (yes / no / partly)
- How likely are you to buy from us again? (0-10)
- Anything we should know about the product? (optional text)
Many teams start from ready-made customer satisfaction survey templates rather than writing B2C quality questions from scratch.
Product Quality Questions by Category
Generic quality wording underperforms almost everywhere. What “quality” means to someone buying a jacket has nothing to do with what it means to someone buying software.
Physical Goods and Apparel
- Did the item match the size, colour, and material described?
- How would you rate the stitching, seams, or finish? (1-5)
- Has it held up through washing or cleaning?
- Does it still look the same after a month of use?
- Was the fit what you expected? (too small / right / too large)
Electronics and Appliances
- Does battery life match what was advertised?
- Have you had any crashes, freezes, or unexpected shutdowns?
- How would you rate build quality when you hold it? (1-5)
- Was setup straightforward, or did you need help?
- Have software updates improved or worsened performance?
- Does it run hot, loud, or draw more power than you expected?
Food, Beverage, and Consumables
- How would you rate taste, texture, and freshness? (separate ratings)
- Was the product consistent with previous purchases you’ve made?
- Did it arrive within its shelf life and properly sealed?
- Was the packaging easy to open and reseal?
- Did the portion or quantity match what you expected?
Software and Digital Products
- How often do you run into bugs or errors? (never, rarely, weekly, daily)
- How would you rate speed and responsiveness? (1-5)
- Has an update ever broken something that used to work?
- Is anything about the interface confusing or hard to find?
- Does the product do what the marketing said it would?
- How much does it slow you down when something goes wrong?
When Do Companies Send Product Quality Surveys
Timing changes what a product quality survey can actually detect.
Transactional Trigger Points
- Post-delivery surveys go out within days of receipt, aimed at first-impression defects like damaged packaging or missing parts. Many follow the standard post-purchase survey questions format.
- Support-ticket triggers fire automatically once a return or warranty claim closes.
Catching a defect within the first week costs far less than discovering it during a recall investigation months later.
Time-Based and Recurring Triggers
Durability claims need distance, not a snapshot.
Products get resurveyed at 30, 60, or 90 days to test whether performance holds up under real use, which is the same logic JD Power applies by fielding its Initial Quality Study around the 90-day mark.
The question should change with the timing, not just repeat:
| When | What to ask |
|---|---|
| On delivery | Did it arrive undamaged and complete? |
| Week 1 | Did setup and first use go smoothly? |
| Day 30 | Is it performing the way you expected? |
| Day 90 | Any problems, faults, or wear so far? |
| Month 12 | How has it held up, and would you buy it again? |
| After a return | What made you send it back? |
Subscription and software products often run a recurring version instead, closer to pulse survey question formats, timed to renewal cycles rather than fixed calendar dates.
What Are the Common Bias Errors in Product Quality Survey Questions
Wording choices distort product quality data before a single response comes in.
Wording problems tend to repeat across bad quality surveys.
- Leading questions that assume satisfaction instead of testing for it, like asking how much a customer loves a product rather than whether it worked
- Double-barreled questions that combine two traits in one item, such as asking about design and durability together
- Negatively worded items that lower response accuracy because respondents misread the reverse phrasing
- Social desirability bias on questions tied to brand loyalty, where respondents answer how they think they should feel
- Unbalanced scale midpoints that skew results toward one end before a single answer gets recorded
Weak Questions and Better Versions
| Weak version | What breaks | Better version |
|---|---|---|
| How much do you love your new [product]? | Assumes the answer | How would you rate the quality of the product? (1-5) |
| Is the product well designed and durable? | Two traits, one score | Split into design and durability questions |
| The product did not fail to meet expectations | Double negative confuses people | The product met my expectations. (agree / disagree) |
| Rate the quality | Quality means different things to everyone | Name the trait: build, finish, performance, lifespan |
| Were you satisfied? | Sentiment, not evidence | Did anything about the product not work as expected? |
| How good is our premium construction? | Marketing language inside the question | How would you rate how the product is built? (1-5) |
Long batteries of rating-scale questions compound the problem through respondent fatigue.
Reviewing ways to avoid survey fatigue helps keep attention from dropping before the last item on the page.
What Sample Size Produces Reliable Product Quality Survey Results
A 95% confidence level with a 5% margin of error sets the standard baseline most product quality researchers work from.
Reaching that threshold on a finite customer population usually means running the numbers through Slovin’s formula or an online sample size calculator instead of guessing at a round number.
SurveyMonkey’s 2025 platform data puts opted-in email response at 49.17% for surveys sent to a warm, recognized list (SurveyMonkey, 2025).
Cold or unfamiliar lists commonly land closer to 20 to 30%, the band most external CSAT and quality surveys should plan around.
Response volume that thin makes segmentation risky. Splitting results by SKU, region, or production batch before hitting a minimum response threshold turns noise into something that looks like a pattern.
Reducing form abandonment matters just as much as list size once a survey goes live. A shrinking completion rate quietly erodes the same sample a calculator just told you to reach.
Which Tools Are Used to Run Product Quality Surveys
IDC’s 2025-2026 evaluation of Voice of the Customer application vendors points to a market-wide shift toward omni-channel feedback collection and AI-driven analytics among survey tools (IDC).
| Tool | Best For | Distribution |
|---|---|---|
| Qualtrics | Large-scale, multi-brand programs | Email, web, in-app, IVR |
| SurveyMonkey | Mid-market transactional surveys | Email, web link, popup |
| Zonka Feedback | SMB to mid-market, omnichannel | Email, SMS, WhatsApp, kiosk |
| HubSpot | CRM-triggered post-purchase surveys | Email, embedded forms |
Enterprise Survey Platforms
Vendr’s 2026 buyer data puts median annual Qualtrics spend at $30,000, with real contracts ranging from $6,880 to $139,920 depending on interaction volume and modules purchased (Vendr, 2026). That range makes sense once you consider what Qualtrics actually runs: product, customer, employee, and brand data, all through a single XM Platform, which is why it anchors most large-scale product quality programs.
That per-interaction pricing model fits manufacturers running continuous reliability and durability tracking across thousands of monthly responses. It fits a team testing one product line a lot less.
Lightweight and Automated Survey Tools
Not every lightweight option from a year ago is still standing.
Qualtrics, which also owned Delighted, shut the tool down completely by June 30, 2026, after cutting off new signups the previous July (Qualtrics, 2026).
Zonka Feedback absorbed much of that displaced volume, offering a free migration path and connecting to more than 50 platforms including Salesforce, HubSpot, and Zendesk (Zonka Feedback, 2026).
Teams already running a WordPress site sometimes skip a dedicated subscription entirely. They lean on WordPress survey plugins, or build the instrument directly by learning how to create a survey form without adding another vendor contract.
What Metrics Are Calculated From Product Quality Survey Responses
Raw ratings only become useful once they convert into a repeatable score.
| Metric | Formula | What It Tracks |
|---|---|---|
| CSAT | Satisfied responses / total x 100 | Satisfaction with one interaction or unit |
| Defect rate | Defective units / units surveyed x 100 | Physical failure frequency |
| ACSI-style index | Weighted average across satisfaction items | Sector-wide benchmark comparison |
CSAT applies a top-two-box method: responses of 4 or 5 on a 5-point scale count as satisfied, divided by total responses (Open, 2026).
Cross-industry CSAT averages sit between 76% and 78%, so a product quality program scoring meaningfully below that band is underperforming its peers, not just its own history (Open, 2026).
Defect rate runs the same logic in reverse. Defective units reported divided by units surveyed, expressed as a percentage instead of a satisfaction figure.
The American Customer Satisfaction Index applies this same weighted-average approach at a national scale, holding at 76.9 out of 100 in the fourth quarter of 2025 across roughly 200,000 interviews spanning more than 400 companies (ACSI, 2025).
Reliability Testing of the Survey Scale Itself
Cronbach’s alpha checks whether the items in a multi-question quality scale are actually measuring the same underlying trait.
A coefficient of 0.7 or higher is the threshold Nunnally set in 1978, and most survey teams still use it today (Nunnally, 1978).
A score above 0.9 usually signals redundant questions rather than strong reliability. The fix is trimming the scale, not adding more items.
How Is Product Quality Survey Data Analyzed and Applied
Cross-tabulating quality scores against SKU, region, or production batch turns a single average into a diagnostic tool.
A defect rate that looks acceptable in aggregate can hide one factory line, or one batch code, driving nearly all of the complaints.
Failure Mode and Effects Analysis borrows survey-reported defects as raw input, then ranks them with a Risk Priority Number: severity times occurrence times detection, each scored 1 to 10 (Juran Institute).
A cracked hinge rated severe and frequent outranks a minor cosmetic scuff on that scale, even when the scuff generates more raw complaints in a different batch.
High RPN defects go straight to engineering for root-cause work. Moderate issues just get logged for the next design review cycle, and low-severity cosmetic complaints feed the roadmap backlog instead of triggering anything immediate.
Teams that want a repeatable process for this step can review how to analyze survey data instead of rebuilding a workflow from scratch every quarter.
The same data that flags a defect for engineering often ends up reshaping warranty terms or return policy once a pattern holds across multiple survey cycles.
FAQ on Survey Questions About Product Quality
How many questions should a product quality survey include?
Most product quality surveys run 3 to 10 questions. Transactional, post-delivery surveys stay closer to 3. B2C instruments rarely pass 5. Longer batteries push respondents toward fatigue and cut completion sharply, so brevity usually wins over comprehensiveness.
Should product quality surveys be anonymous?
Anonymity raises honesty on sensitive defect reports, but it removes the ability to follow up on a specific unit or batch. Most B2B programs stay identified for that reason. EU respondents fall under guidance on GDPR compliant forms too.
Can product quality be measured without surveying customers directly?
Partially. Return rates, warranty claims, and lab-based durability testing all measure quality without a single survey question. None of that captures perceived value or design satisfaction, though, which is why most programs pair inspection data with direct customer input.
What is the difference between a quality survey and a customer service survey?
A quality survey asks about the product itself. Does it work, does it last. Standard customer service survey questions measure the support interaction around a purchase instead, things like response time or agent helpfulness, not the physical item.
Is Net Promoter Score a reliable proxy for product quality?
Only partially. NPS measures overall loyalty and word-of-mouth intent, which correlates with quality but also reflects price, brand reputation, and service. A poor product can still score well if support recovers the relationship afterward.
Do online reviews count as product quality survey data?
Not in the strict sense. Reviews are unprompted and unstructured. They also skew toward extreme experiences, the very happy and the very angry, not the average buyer in between. Structured survey questions sample a broader, more representative group, which is why analysts treat reviews as a supplement, not a replacement.
Do product quality surveys need demographic questions?
Rarely, and only when quality perception varies by user group. A handful of demographic survey questions can help segment results by age or region. Too many, though, and a short survey turns into one people abandon halfway through.
Can one question measure more than one quality dimension at once?
Technically yes, but it usually backfires. A question combining durability and design forces respondents to average two different judgments into one answer, which blurs the data. Separate questions per dimension produce cleaner, more actionable results.
Which industries rely most heavily on product quality surveys?
Automotive and manufacturing lead, largely due to decades of Total Quality Management practice and standards like ISO 9001. Electronics, appliances, and medical devices follow closely, since defect rates in those categories carry higher safety and liability stakes.
What happens to a product quality survey response after a customer submits it?
Responses typically route into a dashboard, then get tagged by SKU, region, or severity. High-severity flags reach engineering or QA directly. Lower-priority responses feed quarterly reporting, closing the loop between a single answer and a broader product decision.
Conclusion
Most teams treat survey questions about product quality as a one-time checklist, then wonder why the numbers drift six months later.
Pilot the instrument on 20 to 30 real respondents before rolling it out company-wide. A wording problem or a biased scale costs far less to fix in a pilot than after three quarters of skewed defect data.
Pick one dimension to own first, usually reliability, since it ties most directly to warranty cost and repeat purchase. Expand into durability and design only once that baseline holds steady.
The real constraint isn’t which platform or scale a team picks. It’s whether anyone owns the follow-up once a score drops.
Assign a name, not a department, before the first response comes in.