
Most lead magnets don’t work. They get downloaded, skimmed for 30 seconds, and forgotten. Meanwhile, your email list fills up with people who will never buy anything. The problem isn’t…
Table of Contents
Static forms convert at 2-3%. Quizzes hit 30-50%.
That gap explains why smart marketers are rethinking how they capture leads.
Learning how to use quizzes and interactive forms for lead generation changes more than your opt-in rates. It transforms how you understand your audience.
Every answered question reveals preferences, pain points, and purchase intent. Your email list grows while your segmentation improves automatically.
This guide covers quiz types that match different business models, form optimization tactics that reduce abandonment, and the automation setup that turns quiz takers into customers.
Whether you run an ecommerce store or a B2B SaaS company, interactive content outperforms traditional lead capture methods.
What is a Lead Generation Quiz
A lead generation quiz is an interactive content piece that asks visitors a series of questions in exchange for personalized results.
The visitor answers questions, provides an email address, and receives tailored recommendations or insights.
Unlike static lead capture forms, quizzes create a two-way conversation.
They collect contact details while simultaneously gathering data about preferences, pain points, and purchase intent.
Quiz funnels work because people love learning about themselves. That curiosity drives completion rates far higher than traditional opt-in forms.
The primary function sits at the top of your marketing funnel. Attract visitors, engage them with questions, capture their email, then segment them based on answers.
How Lead Generation Quizzes Work
The mechanics follow a simple flow.
Visitor lands on your page, sees a compelling quiz title, clicks to start.
Each question reveals more about the person taking it. Their goals. Their challenges. Their preferences.
After 6-8 questions, a lead capture form appears. Most platforms show this before revealing results.
The visitor enters their email to unlock personalized outcomes.
Here is where segmentation happens automatically. Based on quiz answers, your email marketing platform tags the new subscriber.
Someone interested in skincare gets tagged differently than someone focused on anti-aging. Same quiz, different follow-up sequences.
Your CRM connection handles the routing. Zapier or native integrations push data from Typeform, Interact, or Outgrow directly into HubSpot, ActiveCampaign, or Mailchimp.
No manual sorting required. The quiz does the qualification work for you.
Types of Lead Generation Quizzes
Choose based on your audience, product complexity, and sales cycle.
Research from Interact shows quizzes convert 40.1% of people who start into leads. Interactive content generates twice as many conversions as passive formats, according to industry studies.
Assessment Quizzes
Evaluate where prospects stand against benchmarks or best practices.
Security audits, marketing maturity checks, financial health assessments. B2B companies see highest conversion with this format because prospects want their score.
Outgrow data shows assessment quizzes achieve 45-65% completion rates. The format works when it identifies problems people didn’t fully understand.
Implementation: Structure questions around measurable outcomes. Compare results to industry standards. Provide specific improvement paths based on score ranges.
Personality Quizzes
People love discovering which category they fall into.
Style finders, traveler types, leadership profiles. B2C brands and lifestyle companies perform well here. According to Outgrow’s research, personality quizzes hit 60-80% completion rates (highest among all quiz types).
The shareability drives organic reach. Studies show 60% of consumers are more likely to share interactive content on social media.
Implementation: Create 4-6 distinct personality types. Make each result feel positive and aspirational. Include social sharing buttons on results pages.
Product Recommendation Quizzes
Match customers to specific products through guided questions.
Warby Parker asks about face shape and style, then suggests frames. Skincare brands identify concerns, then recommend solutions.
Big Sur AI reports that businesses implementing product quizzes see up to 30% conversion rate increases. Research shows personalized recommendations make 28% of shoppers more likely to buy products they didn’t initially plan to purchase.
Works for ecommerce and SaaS with multiple offerings. The quiz acts as guided selling while building your list.
Implementation: Limit questions to 5-7 (shorter quizzes convert better). Map answers directly to product attributes. Show 2-3 recommendations, not 10.
Knowledge Quizzes
Test what audiences know about your industry.
Trivia formats, skill assessments, certification readiness. Education companies and authority-positioning brands use this to establish credibility while capturing leads.
Studies indicate completion rates range from 40-65% depending on difficulty and relevance.
Implementation: Make questions progressively harder. Provide immediate feedback after each answer. Gate full results behind email opt-in.
Diagnostic Quizzes
Help prospects identify problems they don’t fully grasp.
ROI calculators, problem identifiers, needs assessments.
According to Interact’s 2026 analysis, the most effective quizzes identify if someone has a problem. This trend started in 2024 and continues to dominate performance metrics.
Consulting firms and complex B2B sales benefit most. The quiz educates while qualifying.
Implementation: Start with symptom-based questions. Quantify the problem’s impact. Deliver a score with severity levels. Include next-step recommendations.
Performance Tracking:
Monitor these metrics across all quiz types:
- Start rate (traffic to quiz starts)
- Completion rate (starts to finish)
- Lead conversion rate (completions to email opt-ins)
- Sales conversion (leads to customers)
Interact data shows 65% of quiz starters complete all questions. Use this as your baseline benchmark.
What is an Interactive Form
An interactive form responds to user input in real time.
Static forms show every field at once. Interactive forms adapt based on what someone enters.
Conditional logic powers this behavior. Answer one question, and the next question changes accordingly.
The experience feels like a conversation rather than paperwork.
Key interaction elements include progress bars, one-question-at-a-time displays, image-based answers, and dynamic field validation.
For lead capture, interactive forms reduce friction. People complete them at higher rates because the experience feels lighter, even when collecting the same amount of data.
Types of Interactive Forms for Lead Generation
Match the form type to your conversion goals and audience expectations.
According to Fluent Forms research, multi-step forms convert 86% higher than traditional single-page forms. Research from Martal shows interactive content generates 2x the engagement of passive content.
Multi-Step Forms
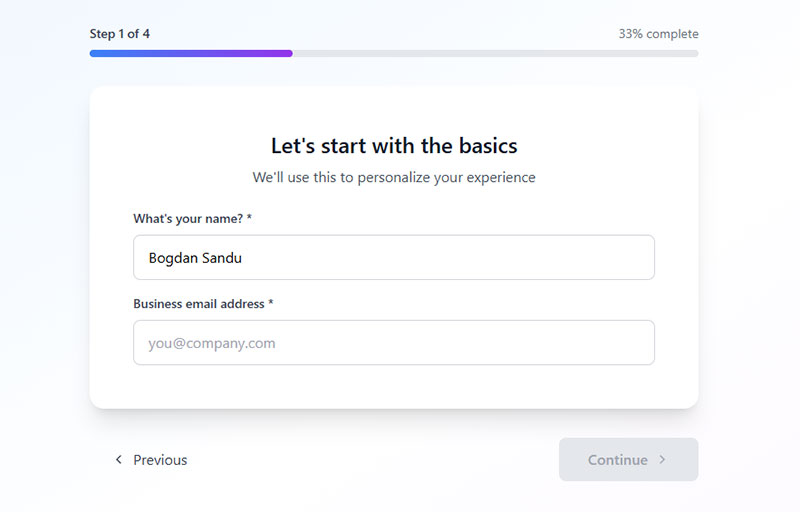
Break long forms into smaller chunks across multiple screens.
Multi-step forms show one or two fields per step with a progress indicator.
Studies show completion rates jump from 34% (single-step) to 71% (multi-step) for forms with 6-15 fields. According to IvyForms analysis, breaking long forms into 3-4 steps increases conversions by 300% compared to single-page versions.
Only 40% of marketers use multi-step forms, yet those who do report 17% higher satisfaction with lead generation efforts.
Implementation tactics:
- Limit each step to 2-3 fields maximum
- Show progress indicators (increase completion by 62% according to Carbon UI)
- Start with easy questions, end with email/phone
- Use logical grouping (personal info, preferences, contact)
Conditional Logic Forms
Fields appear or hide based on previous answers.
Form builder with conditional logic asks relevant questions only. A contractor asking about project type only shows roofing questions if someone selects roofing.
Data from WPForms shows dynamic forms increase conversion rates by up to 160%. Data quality improves because irrelevant questions never appear.
Implementation tactics:
- Map question paths before building
- Keep logic simple (avoid nested conditions beyond 2 levels)
- Test all possible paths
- Use skip logic to reduce total question count
Conversational Forms
One question at a time in a chat-like interface.
Conversational forms mimic messaging apps. Typeform popularized this format.
According to Qualified research, businesses using conversational approaches see a 21% stronger lead acceptance rate and 36% higher conversion versus traditional forms. Mobile users particularly respond well to this approach.
Chili Piper data shows form completion rates double (from 30% to 66.7%) when conversational scheduling follows form fill.
Implementation tactics:
- One question per screen
- Use natural language in questions
- Provide immediate feedback after each answer
- Add personality with micro-copy
- Enable keyboard navigation for desktop users
Calculator Forms

Visitors input data and receive computed results.
Mortgage calculators, ROI estimators, pricing tools.
Research from Calconic shows interactive calculators achieve 40-50% conversion rates versus 20% for passive content. According to Jasmine Hetfeld at Kulaniapia Falls, leads that submit a calculator close at 5x the rate of simple inquiries.
Studies indicate interactive tools generate 4-5x more page views than static pages. The value exchange is immediate and tangible.
Implementation tactics:
- Limit inputs to 3-5 key variables
- Display results dynamically as users type
- Show value in concrete terms (dollars saved, time reduced)
- Gate detailed results behind email capture
- Provide social proof near calculator (testimonials, number of calculations)
Cross-format optimization:
Zuko Analytics research shows these universal improvements work across all form types:
- Autofill increases conversion by 10%+
- Reducing fields from 11 to 4 boosts conversion by 120%
- Forms with 3 fields hit 25% conversion vs 15% for 6+ fields
- Phone number fields reduce conversion by 5% (make optional when possible)
- CAPTCHAs cut conversion by 40% (avoid unless necessary)
Testing priorities:
According to HubSpot, marketers who A/B test forms report 10% higher conversion rates versus those who don’t test. 36% never run user tests (leaving easy wins on the table).
How to Create a Lead Generation Quiz

Strategy first, software second.
Define the Quiz Goal
Pick one clear objective. Lead volume? Audience segmentation? Product recommendations? Sales qualification?
Your goal determines question types, result categories, and follow-up sequences.
Decide where this quiz sits in your lead generation funnel. Top of funnel quizzes build email lists. Bottom of funnel quizzes qualify prospects for sales conversations.
According to Interact data, service provider quizzes hit nearly 50% conversion rates when focused on qualification. E-commerce product recommendation quizzes drive different metrics (list building over immediate conversion).
Goal alignment checklist:
- What action defines success? (email capture, purchase, booking)
- Which funnel stage are you targeting?
- What data do you need to collect?
- How will results map to offers?
Identify Target Audience Pain Points
Map buyer personas to specific challenges.
A fitness brand might identify: lack of time, nutrition confusion, plateau frustration, equipment limitations.
Each pain point becomes a potential quiz result category. Questions sort people into these buckets.
Goal questions reveal what someone wants to achieve. Problem questions uncover what blocks them. Both inform segmentation strategy.
Pain point framework:
- List 3-5 major customer challenges
- Match each challenge to a quiz result
- Create questions that identify which challenge fits each person
- Design follow-up content that addresses that specific pain
Choose Question Types and Flow
Multiple choice works best for most quiz funnels. Easy to answer, easy to score, easy to segment.
Image-based answers increase engagement. People process visuals faster than text.
Research from Interact shows top-performing quizzes with branching logic use 7 questions. Non-branching quizzes need 12 questions to gather equivalent data. Branching routes people down different paths based on responses (someone selecting “beginner” sees different follow-ups than “advanced”).
Keep total questions between 6-10. According to Survicate research, surveys with 4-8 questions hit 65.15% completion rates versus 41.94% for 15+ questions.
Question optimization:
- Start with easy, engaging questions (builds investment)
- Place important qualification questions in the middle (when committed)
- Save sensitive questions for the end (budget, contact info)
- Use progress indicators (increase completion by 28% per Email Conversion Lab)
- Limit question text (each additional word reduces completion)
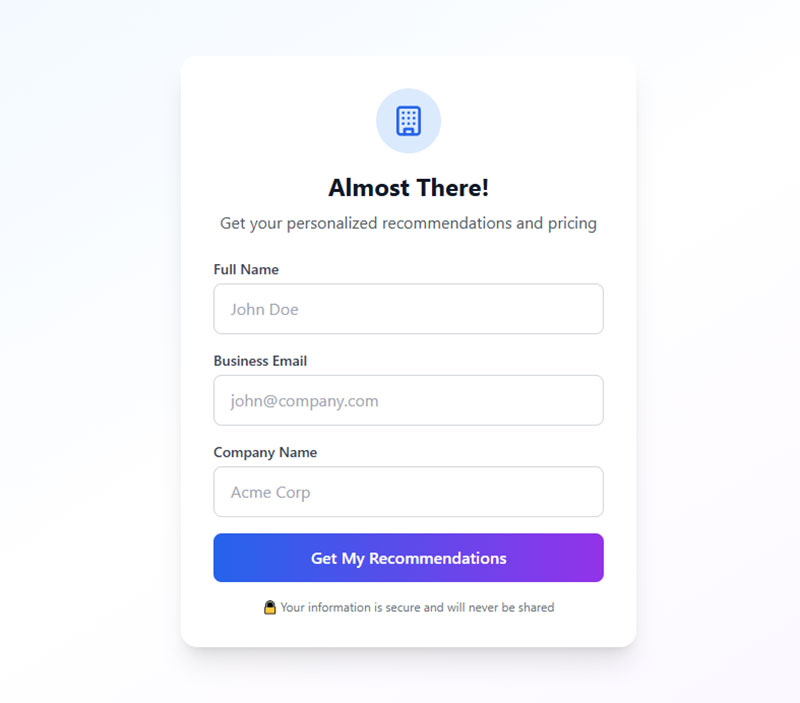
Design the Lead Capture Form
Gate placement matters.
Most successful quizzes place email capture after questions but before results. According to Email Conversion Lab research, placing email collection at question 3 or 4 (not at start) increases completion rates by 40%.
People invested time answering. They want their outcome.
Ask for email only if possible. Every additional form field reduces conversions. Research shows reducing fields from 11 to 4 increases conversions by 160%.
Interact recommends collecting first name and email maximum for personalization. Phone number kills opt-in rates unless you’re in high-ticket sales.
According to Landerlab analysis, strategically placed lead capture forms convert at rates 3-5x higher than standard website opt-in forms when users understand the value.
Form optimization tactics:
- Make email optional (increases completions, accepts lower lead volume)
- Explain value exchange (“Get your personalized results via email”)
- Include clear privacy statement (GDPR compliant forms require explicit consent)
- Use action-oriented button text (“Show My Results” vs “Submit”)
- Test skip option (better quality leads who truly want results)
Set Up Result Segmentation
Each quiz outcome maps to an email list segment or CRM tag.
Connect your quiz builder to email marketing platform through native integrations or Zapier. LeadQuizzes, Interact, and Outgrow support major platforms like Klaviyo, GetResponse, and Salesforce.
TB12 case study via Octane AI shows quiz takers hit 5.22% conversion rate with 13% increase in on-site conversion from personalized recommendations.
Define automation triggers. Quiz result A sends welcome sequence A. Quiz result B sends welcome sequence B.
Segmentation strategy:
- Map each result to specific email sequence
- Tag leads in CRM with quiz result data
- Track quiz performance through entire funnel (not just opt-in rate)
- Test result-specific offers against generic messaging
- Monitor which segments convert to customers
Data flows automatically. No manual list management required.
According to Interact, top-performing quizzes maintain 70% average completion rate and 41% average opt-in rate for lead generation. These benchmarks require strategic quiz design, not just launching any quiz.
How to Create an Interactive Lead Form
Interactive forms require attention to form UX design over content strategy.
Select Form Type Based on Goal
High volume needs? Use simple multi-step forms with minimal fields.
Research from Fluent Forms shows multi-step forms convert 86% higher than single-page equivalents. Only 40% of marketers use them, leaving easy wins on the table.
High qualification needs? Use conditional logic forms that ask detailed questions based on responses. According to WPForms, dynamic forms increase conversion by up to 160%.
Match form complexity to funnel stage. Landing page forms for paid traffic should be shorter than forms for organic visitors who already trust your brand. Paid traffic converts at 1.3% on average versus 2.4% for organic traffic.
Form selection framework:
- Simple contact forms: 3-5 fields maximum (Forrester Research optimal range)
- Lead qualification forms: 6-10 fields with conditional logic
- Application forms: Multi-step with 3-4 sections (highest completion at 75%)
- Product inquiry forms: Mix of multiple choice and conditional fields
Structure the Question Sequence
Start with easy, non-threatening questions. Name and email come last.
Data from Brixon Group shows willingness to share sensitive information (budget, phone) increases by 215% after consuming at least three valuable content pieces. Apply this to forms: build trust before asking for high-value data.
Progressive disclosure keeps people moving forward. Show one question, get an answer, reveal the next.
According to Formstack research, 35% of users decide in the first 10 seconds whether to complete or abandon. Those initial questions determine completion rates.
Mobile forms need more attention to sequence. Desktop converts at 55.5% (starter to completion) versus 47.5% for mobile. Thumb-friendly buttons, large tap targets, vertical scrolling only.
Sequence optimization:
- Question 1-2: Easy demographic or preference questions (no personal data)
- Question 3-5: Value-building questions (what they need, what problems they face)
- Question 6+: Contact information and sensitive data
- Place password fields last (10.5% abandonment rate, highest of all fields per Zuko)
- Email and phone have 6.4% and 6.3% abandonment rates (second tier risk)
Add Conditional Logic
Route users based on answers to show only relevant fields.
A WordPress form with file upload might only display upload if someone selects a specific service type.
Skip logic reduces form length dynamically. Someone answering “No” to a qualifying question sees a shorter path than someone answering “Yes.”
According to HubSpot research, each additional form field decreases conversion by 4.1% on average. Conditional logic lets you gather more data without showing more fields upfront.
Conditional logic tactics:
- Show pricing questions only to qualified leads
- Display industry-specific fields based on sector selection
- Skip optional sections for users in a hurry
- Branch to different thank-you pages based on answers
- Trigger different email sequences per response path
Design the Form Layout
Above-fold placement captures attention immediately. Nielsen Norman Group data shows content above the fold captures 57% of page-viewing time.
White space around fields improves readability. Cramped forms feel overwhelming.
Follow form design principles: left-aligned labels, single-column layout, clear visual hierarchy.
CXL research shows users complete single-column forms 15.4 seconds faster than multi-column forms. That gap is larger on mobile (vertical scrolling priority).
Layout specifications:
- Use single-column layout (15.4 seconds faster completion)
- Place labels above fields (higher completion rates)
- Ensure 44-51px minimum button height (average across high-converting forms)
- Create 48px minimum tap targets for mobile
- Maintain consistent field widths (reduces cognitive load)
CTA Button Design
Call-to-action buttons need high contrast colors and specific text.
Research from Wiser Notify shows specific, clear CTAs increase conversion by 161%. “Get My Results” beats “Submit” every time.
According to analysis of 2,588 A/B tests, blue buttons win 31% of the time (highest success rate), followed by green at 22% and red at 16%. Context matters more than absolute color.
Scoop Market data shows:
- Websites with prominent CTA buttons: 17.85% average conversion
- Websites with less prominent CTAs: 11.48% average conversion
- Including buttons instead of text links: 28% conversion increase
- Contrasting colors versus background: 38% conversion increase
CTA optimization:
- Use 2-4 word button text (“Get Started” performs better than “Book A Demo”)
- Choose high-contrast color against page background
- Make buttons 45-90% wider than minimum text width
- Add action verbs (“Download,” “Get,” “Start” outperform “Submit”)
- Test personalized CTAs (202% better performance than generic)
Connect to Email Marketing System
Set up automation triggers before launching.
When someone submits, data pushes to CRM immediately. Tags apply based on form responses. Welcome sequences fire automatically.
Check your WordPress email settings if notifications aren’t arriving. Most delivery issues trace back to server configuration.
According to HubSpot data, forms with 3-5 fields hit the optimal balance for B2B lead generation. Over 30% of marketers report highest conversion with 4-field forms.
Integration checklist:
- Map form fields to CRM custom fields
- Create tags for each answer path
- Test automation triggers with sample submissions
- Set up segmented welcome sequences per form result
- Monitor form-to-customer conversion (not just opt-in rate)
Quiz and Form Placement Strategies
Where you put your quiz or form affects conversion rates as much as content.
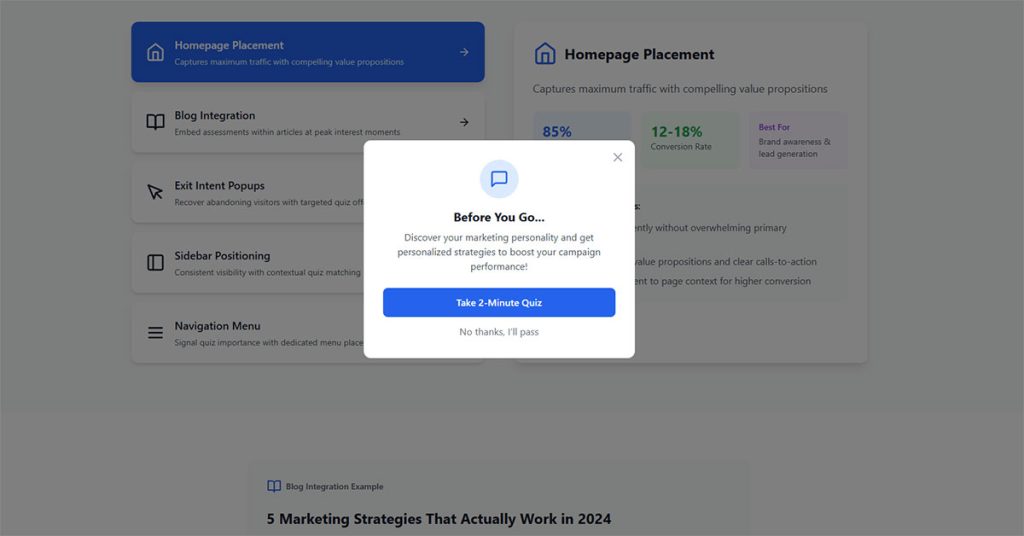
Homepage Placement
High traffic, mixed intent. Homepage quizzes work when they promise immediate value.
Warby Parker’s frame finder lives on their homepage because every visitor potentially needs glasses. Match quiz topic to universal visitor needs.
According to Wisepops data analyzing 1B+ displays, popups appearing on the second page a visitor views generate 28.98% conversion rate. Homepage placement on first visit underperforms, but works for universal tools everyone needs.
Homepage optimization tactics:
- Focus on universal problems (everyone visiting needs the solution)
- Use quiz as navigation tool rather than lead capture
- Deploy after 11-15 seconds (Wisepops optimal timing for UX and conversion)
- Bottom-center placement converts at 12.88% (2025 top position per Wisepops)
- Skip homepage entirely for niche products (use targeted landing pages instead)
Landing Page Integration
Dedicated pages for specific campaigns convert highest.
One quiz per page. No competing calls to action. Facebook Ads or Google Ads traffic lands directly on the quiz without distractions.
Data from Unbounce shows landing pages with single CTA convert at 13.5% versus 11.9% for 2-4 CTAs. HubSpot research confirms landing pages achieve 23% signup rates (highest of all form types), while popups make up 66% of signup forms but only convert 3%.
Research analyzing 41,000 landing pages with 464 million visitors found 6.6% median conversion rate (Q4 2024). Top performers exceed 15%.
Landing page specifications:
- Single quiz, zero navigation, one CTA
- URL-targeted content (5.80% conversion vs 2.30% untargeted per Wisepops, 152% improvement)
- Mobile-first design (mobile popups convert 6.57% vs 3.77% desktop per Getsitecontrol)
- Load under 3 seconds (32% higher conversion per Invesp)
- Personalized CTAs (202% better than generic per HubSpot)
Exit-Intent Deployment
Catch people before they leave with an exit intent popup.
WordPress exit intent popup plugins trigger when cursor movement suggests someone is about to close the tab.
Use exit-intent forms as last chance to capture abandoning visitors. Offer quiz as reason to stay engaged.
Exit-intent popups convert 2-4% of abandoning visitors on average. Cart abandonment versions hit 17.12% conversion (OptiMonk). Top performers reach 19.77% (five times average popup performance).
Research from Conversion Sciences shows well-crafted exit messages save 10-15% of abandoning visitors. Exit-intent performs 35% better than simple timed triggers.
Exit-intent best practices:
- Offer quiz results as incentive (“Get Your Results”)
- Target cart abandoners specifically (17.12% conversion vs 2-4% general exit)
- Add countdown timers (14.41% conversion vs 9.86% without per OptiMonk)
- Use multi-step approach (5.64% vs 3.07% single-step per Wisepops)
- Display at scroll-up or back-button tap on mobile (cursor tracking fails on touchscreens)
Blog Post Embedding
Embed quizzes within relevant content.
An article about skincare routines includes “Find Your Skin Type” quiz inline. Topic alignment increases participation rates.
Choose between inline forms or popup forms based on content length and reader behavior patterns.
Research shows inline forms placed after content convert up to 40% better than top-of-page positioning. Blogs average 5%+ conversion rates. Scroll depth triggers at 50-75% page completion target engaged readers who’ve demonstrated interest.
Static inline forms achieve 45.53% success rate versus 25.96% for modal popups (Factors.ai). Quiz-like forms can triple conversions compared to standard forms.
Blog embedding strategies:
- Place quiz after article content (up to 40% better than header placement)
- Trigger at 50-75% scroll depth (targets committed readers)
- Use inline static forms over popups (45.53% vs 25.96% success)
- Match quiz topic exactly to blog content
- Keep quiz short (7 questions optimal with branching logic per Interact)
- Add quiz preview image in-content with click trigger
How to Optimize Quiz Conversion Rates
Small changes compound into significant improvements. Test systematically.
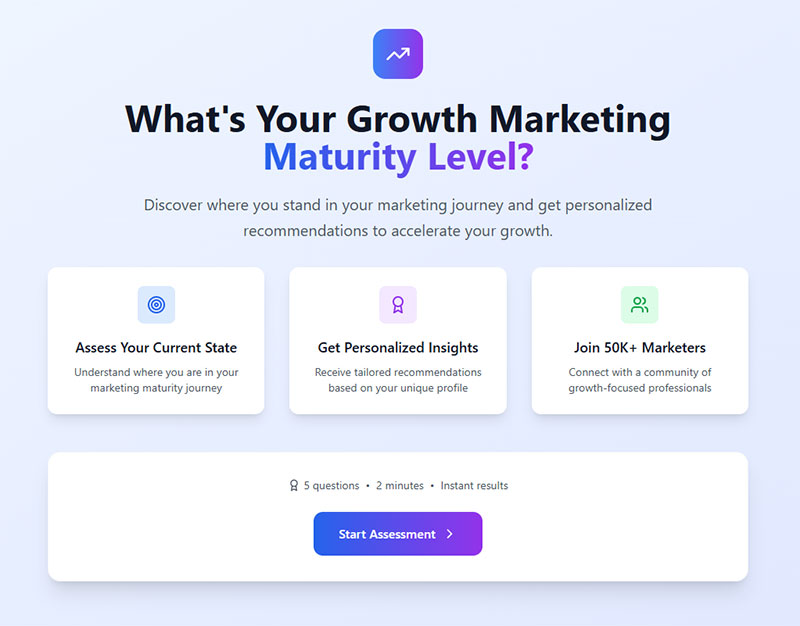
Title and Hook Optimization
Quiz titles need curiosity and specificity.
“What’s Your Marketing Style?” beats “Take Our Quiz.” Personal pronouns like “your” increase click rates.
Promise a benefit. “Discover Which Workout Plan Fits Your Schedule” tells people exactly what they’ll get.
According to Interact data analyzing 80 million quiz leads, quiz titles under 15 words and descriptions under 25 words convert best. Longer copy increases drop-off before people even start.
Research shows quiz cover pages that speak directly to user needs see higher completion. Generic titles kill conversion before the quiz begins.
Title optimization checklist:
- Keep titles under 15 words (Interact optimal length)
- Use personal pronouns (“Your,” “You,” not “Our”)
- Frame as question addressing meaningful problem
- Promise specific outcome, not generic value
- Test value proposition variations (“Discover” converts 52% better than “Take our quiz” per Email Conversion Lab)
Question Length and Complexity
Follow the three-minute rule. Six to eight questions with three to four answer options each.
Data from Outgrow shows short quizzes (3-7 questions) achieve 65-85% completion rate. Medium quizzes (8-15 questions) drop to 45-65%. Long quizzes (16+ questions) fall to 25-45%.
Interact’s 2026 research confirms 65% of quiz starters complete all questions. The sweet spot is seven questions where engagement peaks before drop-off accelerates.
Longer quizzes work only for serious topics. Health assessments can run 15+ questions because stakes feel higher.
According to Survicate data, 1-3 question surveys achieve 83.34% completion. 4-8 questions drops to 65.15%. 9-14 questions hits 56.28%. 15+ questions falls to 41.94%.
Track where people drop off. If question eight sees spike in abandonment, cut or simplify it.
Question design rules:
- 3-7 questions optimal (65-85% completion)
- 8-15 questions acceptable (45-65% completion)
- 16+ questions risky (25-45% completion)
- 3-7 answer options maximum (Miller’s Law: people hold 3-7 items in attention)
- Button answers only (easier to click than type)
- Target 2-4 minute total completion time
- Use branching logic to reduce perceived length (7 questions with branching vs 12 without)
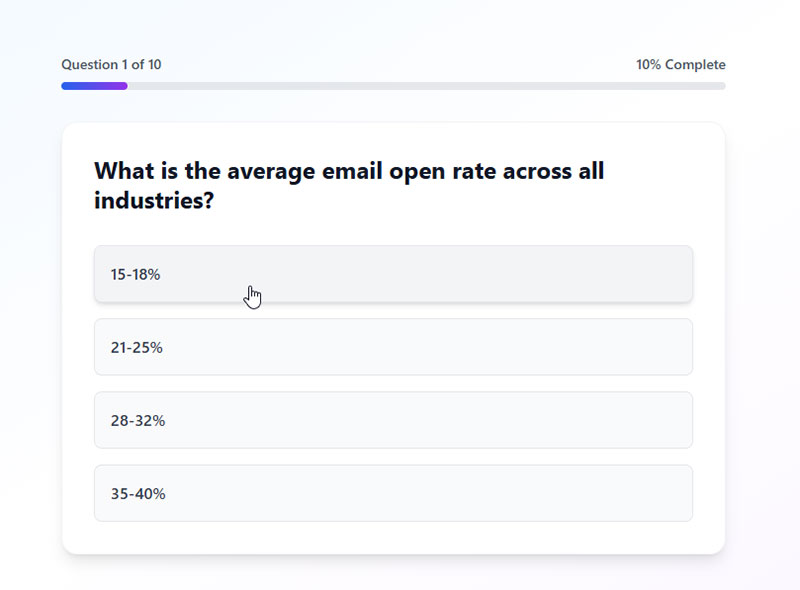
Visual Design Elements
Image choice questions outperform text-only options.
Progress bars reduce anxiety about quiz length. People complete more when they see “3 of 7” than when they see nothing.
Research from Outgrow shows visual progress bars increase completion rates by 12-18%. Non-linear progress bars (that jump ahead unpredictably) perform even better by creating positive surprises.
SurveyMonkey data found progress bars at bottom of page improve completion versus top placement. Visual scale alone (without page numbers or percent) performs best.
Brand consistency builds trust. Match quiz colors and fonts to website.
Design specifications:
- Add progress bar (12-18% completion increase)
- Place progress bar at bottom, not top (SurveyMonkey testing)
- Use visual scale alone (no percentage or page numbers for best results)
- Include images with answer options (increases engagement)
- Maintain brand colors and fonts throughout
- One question per screen (multi-step format, not all-at-once)
- Mobile-responsive design critical (mobile users complete quizzes)
Lead Form Timing
Place email capture between final question and results. Maximum leverage point.
Email Conversion Lab found placing email collection at question 3 or 4 (not at start) increases completion rates by 40%. The psychological principle: build investment before asking for commitment.
Some quizzes show preview of results, then gate full report. Teasing works when full results offer substantial value.
Test different gate placements. Some audiences respond better to pre-quiz capture with “Get results emailed to you.”
According to Okendo research, making email optional increases completions. Higher drop-off at email question suggests disabling it completely and capturing leads through other methods.
Email capture tactics:
- Place at question 3-4 for 40% completion increase (Email Conversion Lab)
- Gate full results after showing preview/teaser
- Make email optional if seeing high drop-off (test impact on both completion and lead quality)
- Use specific value proposition: “Email me my personalized report” vs generic “Submit”
- Display social proof above email field (“Join 10,000+ who discovered their style” lifts conversion 31% per Email Conversion Lab)
- Consider progressive profiling: collect email mid-quiz, gather additional data post-results
How to Optimize Interactive Form Conversion Rates
Forms live or die by friction levels. Remove every unnecessary obstacle.
Field Count Reduction
Each additional field costs conversions. HubSpot 2024 research shows conversion rate decreases by 4.1% with each extra field beyond the minimum required.
Ask yourself: do we actually use this data? If not, delete the field.
Data from Quicksprout demonstrates reducing form from 4 fields to 3 increases conversion by almost 50%. More dramatic: cutting from 11 fields to 4 boosts conversions by 160%.
Research shows 30% of marketers get highest conversion rates from forms with 4 fields. The optimal number for B2B: 3-5 fields (Forrester Research 2024).
Progressive profiling collects additional information over time through subsequent interactions rather than one long form.
According to Marketo Benchmark Report 2024, progressive profiling increases form completion by 35%. SalesForce 2025 research found 47% higher conversion rates with 32% more comprehensive lead profiles versus one-time forms.
Northwestern University study (2024) shows likelihood of disclosing sensitive information (budget, phone) increases by 215% after consuming at least three valuable content pieces. Build trust before asking for high-value data.
Field reduction tactics:
- Start with 3-5 fields maximum (email, name, company for B2B)
- Use progressive profiling for 35-47% completion increase
- Make phone field optional (phone fields reduce conversion by 5% per WPForms)
- Ask for address only when shipping/billing required (address fields: -4% conversion)
- Remove age fields unless critical (-3% conversion impact)
- Delay sensitive questions until after trust is built (215% more likely to share after 3+ content pieces)
- Review conversion rate benchmarks for your industry
Call-to-Action Button Design
High contrast colors demand attention. Orange or green buttons on white backgrounds perform consistently well.
Analysis of 2,588 A/B tests shows blue buttons win 31% of time, followed by green at 22% and red at 16%. Context matters: red on green-heavy sites increases conversion by 21-34%.
Button text should state benefit, not action. “Get My Free Guide” converts better than “Download Now.” WordStream research confirms action words like “get,” “reserve,” and “try” outperform generic “submit” or “enter.”
VWO research found CTA buttons surrounded by more white space increase conversion by over 200%. Simple design change, massive impact.
Wiser Notify data shows specific, clear CTAs increase conversion by 161%. PartnerStack saw 111.55% conversion rate increase changing “Book A Demo” to “Get Started.”
CTA optimization specifications:
- Use high-contrast color versus background (21-38% increase)
- Add white space around button (200%+ conversion increase)
- Write 2-4 word benefit-focused text (“Get Started” beats “Book A Demo” by 111.55%)
- Use action verbs: get, reserve, try, download, start
- Test button vs text link (28% conversion increase with buttons per Scoop Market)
- Ensure 44-51px minimum height (average across high-converting forms)
Mobile Optimization
More than half traffic comes from phones. Desktop converts 55.5% (starter to completion) versus 47.5% for mobile.
Mobile users convert at 42.95% average form completion. Desktop: 47.01%. Tablets: 41.13%.
Desktop conversion rates run 1.7X higher than mobile (Dynamic Yield 2025 data analyzing 200M+ monthly users). Mobile traffic represents 70% of visits but lower conversion per session.
Large buttons, minimal typing, auto-fill enabled. Test on actual devices, not just browser emulators.
Single-column layouts complete 15.4 seconds faster than multi-column (CXL research). This gap expands on mobile devices that prioritize vertical scrolling.
According to Reform data, mobile-responsive landing pages convert 10.7% versus desktop-only designs at lower rates.
Mobile optimization checklist:
- Single-column layout (15.4 seconds faster completion)
- 48px minimum tap targets (mobile usability standard)
- Enable autofill (10%+ conversion increase per Zuko)
- Reduce fields to 3 maximum for mobile forms
- Use appropriate input types (number pad for phone, email keyboard)
- Test on iOS and Android actual devices
- Ensure form loads under 3 seconds (32% higher conversion per Invesp)
Trust Signals
Privacy statements reduce hesitation. Link to full policy near submit button.
Review GDPR consent form examples if collecting data from European visitors.
Security badges, testimonials, and company logos add credibility near forms asking for personal information.
Blue Fountain Media study found forms with Verisign Secured trust badge led to 42% conversion increase. VeriSign EV certificates produced 30% conversion increase for hotel booking industry.
ConversionXL research shows adding security badges and certifications increases conversion by 12.3-15%. 18% of users abandon forms due to security concerns.
GetLeadForms data demonstrates social proof on forms increases conversion by up to 26%. Display “Join 10,000+ subscribers” or similar near email capture.
Baymard Institute found 25% of shoppers abandon carts because they don’t trust site with credit card info. Security payment badges directly address this concern.
Trust signal implementation:
- Add SSL certificate badge near submit button (42% conversion increase in studies)
- Display payment provider logos (Visa, Mastercard, PayPal)
- Include security seals (Norton, McAfee, TrustedSite)
- Show social proof numbers (26% conversion increase)
- Link privacy policy near sensitive fields
- Add industry certifications (GDPR, HIPAA, PCI-DSS compliance badges: 15% increase)
- Display customer testimonials above form
- Use recognizable brand partner logos
How to Segment Leads with Quiz Data
Segmentation turns generic email blasts into targeted campaigns. Quiz answers provide the data automatically.
FluentCRM data shows segmented email campaigns boost opens by 30% and clicks by 50% compared to generic sends. Research from DMA reveals segmented lists drive 30% of total revenue.
Quiz-based segmentation generates conversion rates of 20-40%, with best-performing quizzes reaching 60% (per lead magnet conversion data from 2025). Interactive forms achieve 47.3% conversion versus 2.8% for static forms (Outgrow analysis of 50,000+ forms).
Answer-Based Segmentation
Group subscribers by quiz results.
Pain point categories: people struggling with lead generation get different content than those struggling with conversion.
Product interest clusters: someone who selected “anti-aging” in a skincare quiz receives serum recommendations, not acne treatments.
According to MoEngage research across 5.3 billion emails, segmented campaigns show 4X improvement in unique click-through rates and conversion rates compared to broadcast emails. Dynamic personalization increases conversion rates by 7X in some verticals.
CrazyBulk uses their product recommendation quiz to collect zero-party data feeding into Klaviyo. Segmentation based on fitness goals, dietary preferences, and workout habits enables hyper-targeted campaigns with higher retention.
Answer segmentation tactics:
- Create email sequences for each quiz result type (4-7 different paths typical)
- Tag leads based on primary pain points identified (3-5 categories maximum)
- Segment product recommendations by quiz answers (conversion increases up to 50%)
- Build nurture sequences matching result profiles
- Track which result types convert highest (optimize for quality over quantity)
Demographic Segmentation
Background questions reveal useful context.
Industry, company size, role, experience level. B2B quizzes benefit most from demographic segmentation.
Data from S2W Media shows enhanced buyer profiling leads to 50% better audience segmentation. First-party demographic data from quizzes enables personalized outreach with 35% higher engagement rates.
Include demographic survey questions strategically. One or two max, positioned early in the quiz flow.
According to Brixon Group research, B2B buyers willing to share information increases by 215% after consuming three valuable content pieces. Build trust before asking for detailed demographics.
Demographic segmentation framework:
- B2B: industry, company size (SMB vs Enterprise), role, experience level
- B2C: age range, location, income bracket (only when relevant)
- Position demographic questions at question 2-3 (after initial engagement)
- Keep to 1-2 demographic questions maximum
- Use dropdown or multiple choice (faster completion than text entry)
- Segment budget ranges for B2B (qualified leads convert 3X higher with intent data per ABM targeting research)
Behavioral Segmentation
Track engagement depth alongside answers.
Someone who completed all questions shows higher intent than someone who abandoned at question three.
Interact data shows baseline 65% completion rate for quiz starters. Completion signals higher purchase intent.
Purchase readiness signals: questions about timeline, budget, or decision authority separate browsers from buyers.
Behavioral data analysis from Envive shows RFM-targeted campaigns generate 20% revenue increases. Behavioral segmentation produces 9X higher repeat purchase rates versus first-time conversions.
Research confirms behavioral triggers generate 320% more revenue than standard campaigns (Omnisend 2024 data). Automated emails triggered by specific user actions drive nearly 10X more revenue.
Behavioral segmentation implementation:
Track completion rate by traffic source:
- Email traffic: 70-85% completion typical
- Social media: 45-65% completion
- Paid ads: 35-55% completion
- Organic search: 60-75% completion
Intent signals to segment:
- Budget questions (immediate vs 6+ months): tag as hot/warm/cold
- Timeline responses (“this month” vs “just researching”): separate sequences
- Decision authority (“I’m the decision maker” vs “gathering info”): adjust follow-up urgency
- Engagement depth: completed vs partial (80% completion shows 102% higher conversion per Obvi case study)
Create segments:
- High intent: completed quiz + budget specified + near-term timeline (personalized emails increase engagement by 35%)
- Medium intent: completed quiz + researching phase
- Low intent: partial completion or distant timeline
According to WordStream research, intent data identifies user segments with highest conversion potential. Not everyone interacting shows genuine purchase interest, but behavioral segmentation reveals who does.
Segmentation performance benchmarks:
- General segmentation: 50% conversion rate increase
- Advanced behavioral segmentation: 200% conversion improvement (RFM analysis)
- Segmented emails: 14.31% higher open rates, 100.95% higher click rates
- Quiz leads vs other sources: higher engagement (already had positive brand experience)
- Personalization with segmentation: 10-15% more revenue (McKinsey data on personalization leaders)
Whisker added 5,000 new subscribers in 30 days after launching their quiz. Those subscribers arrived pre-segmented based on answers, enabling highly targeted follow-up communications from day one.
How to Nurture Quiz Leads with Email
Capturing the email is step one. The follow-up sequence determines whether that lead becomes a customer.
Automated nurture sequences convert leads 47% better than single emails according to Annuitas Group research. Nurtured leads make 47% larger purchases than non-nurtured leads.
Lead nurturing emails generate 8% CTR versus 3% CTR for general email sends. Response rates on nurture emails run 4-10X higher than generic broadcast emails.
Result-Specific Follow-Up Sequences
Deliver quiz results via email for higher open rates on your first message.
Welcome emails achieve 91.43% open rate according to Campaign Monitor data. This first email is your highest-engagement opportunity.
The initial email restates their result and provides value aligned with their answers.
Match product recommendations to quiz outcomes. A skincare quiz result triggers a sequence featuring relevant products from your catalog.
According to Aberdeen Group research, personalized emails improve click-through rates by 14% and conversion rates by 10%. Jupiter Research found relevant emails drive 18X more revenue than broadcast emails.
Automated email campaigns generate 320% more revenue than non-automated emails. In 2024, automated emails drove 37% of all email-generated sales despite accounting for just 2% of email volume.
Result-based sequence framework:
Email 1 (immediate):
- Deliver quiz results (91.43% open rate)
- Provide personalized insights based on answers
- Include 1-2 product recommendations aligned with result
Email 2 (day 3-5):
- Educational content related to their result
- Case study or testimonial from similar customer
- Soft CTA to browse relevant category
Email 3 (day 7-10):
- Specific solution addressing their pain point
- Limited-time offer or incentive (test timing for your segment)
- Direct product recommendation with clear value proposition
Email 4 (day 14-21):
- Social proof (reviews, user count, success stories)
- FAQ or objection handling
- Strong CTA with urgency element
Research shows converting a lead takes 5-20 interactions. Build sequences that guide prospects through this journey systematically.
Segmented Campaign Strategies
Pain point sequences address specific challenges identified in the quiz.
Someone who indicated “not enough time for workouts” gets content about 15-minute routines, not hour-long gym sessions.
Campaign Monitor data confirms segmentation drives 760% increase in revenue. Advanced segmentation increases revenue per email dramatically compared to generic sends.
According to HubSpot research, personalized emails improve click-through rates by 14% and conversions by 10%. By role: executives get ROI-driven messaging, while managers get tactical tips.
Timing optimization matters. Test different send frequencies based on segment engagement levels.
Data shows sending 2-4 emails per month yields highest engagement. 86% of companies send marketing emails at least monthly, with 58% emailing weekly or more often.
Best day: Tuesday sees highest open rates. Best time: 11 AM shows best performance for opens and clicks across industries.
71% of B2B marketers use email newsletters to nurture leads. For B2B specifically, aligning content with prospect’s stage in buyer’s journey boosts conversion rates by 72%.
When designing these sequences, apply the same best practices for creating feedback forms to your email surveys: keep them short and focused.
Segmentation tactics by quiz data:
By pain point severity:
- High urgency (needs solution now): 3-5 day sequence, direct product focus
- Medium urgency (researching options): 7-14 day sequence, education + product mix
- Low urgency (early exploration): 14-30 day sequence, value-first content
By budget indicators:
- Premium tier: high-end product recommendations, ROI focus
- Mid-tier: value proposition, feature comparison
- Budget-conscious: starter packages, payment options
By engagement level:
- High (completed quiz + opened first email): accelerate to offer
- Medium (completed quiz, low email engagement): more education content
- Low (partial completion): re-engagement sequence
Send frequency based on engagement:
- Highly engaged: 2X per week possible without unsubscribe spike
- Moderately engaged: 1X per week optimal
- Low engagement: 2-4X per month maximum (44% unsubscribe due to excessive emails)
Re-engagement Tactics
Quiz retake invitations work when you’ve updated the quiz or added new result categories.
Re-engagement campaign statistics: 10% average open rate, but win-back emails achieve 29% open rate (higher than average 21.5% benchmark).
Win-back emails show 10.34% average conversion rate. Conversion rate runs 460% higher than other promotional emails.
However, only 24% of inactive customers read re-engagement emails. Focus on this segment with compelling subject lines and offers.
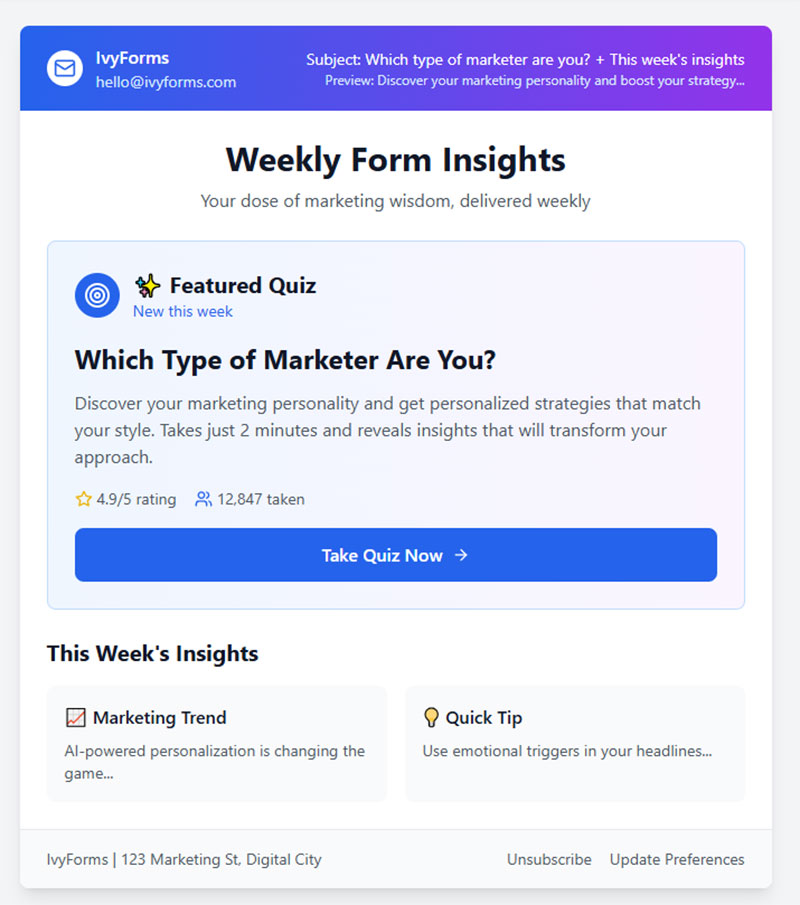
Invite existing subscribers to take new quizzes that further refine their profile.
Interactive content in re-engagement campaigns performs well. Quiz invitations give dormant subscribers reason to engage again with fresh, personalized experience.
Research shows 48.4% of marketers send re-engagement campaigns to inactive subscribers as part of list cleaning strategy.
Track which segments respond to re-engagement campaigns. Dormant subscribers sometimes reactivate with the right interactive content.
Re-engagement sequence structure:
First attempt (30 days inactive):
- Subject: “We miss you – take our new [Topic] quiz”
- Fresh quiz invitation with clear benefit
- Highlight what’s changed or what’s new
Second attempt (60 days inactive):
- Special incentive or exclusive offer
- User-generated content or social proof
- Last chance messaging with deadline
Final attempt (90 days inactive):
- “Should we say goodbye?” clear unsubscribe option
- Feedback request quiz (why they stopped engaging)
- Re-permission campaign asking if they want to stay subscribed
Re-engagement performance optimization:
- Test subject lines with urgency vs curiosity (A/B test everything)
- Use “We miss you” messaging (personal touch increases response)
- Offer exclusive discount or early access as re-engagement incentive
- Make unsubscribe easy (clean list improves overall deliverability)
- Time re-engagement for Tuesday at 11 AM (highest engagement window)
- Include social proof in re-engagement emails (26% higher open rates)
Nurtured leads produce 20% increase in sales opportunities versus non-nurtured leads according to DemandGen Report. Companies excelling at lead nurturing generate 50% more sales-ready leads at 33% lower cost.
The data is clear: systematic nurture sequences transform quiz leads into customers at significantly higher rates than one-off emails.
Quiz and Form Tools Comparison
| Tool | Primary Focus | Core Strength | Best For |
|---|---|---|---|
| Typeform | Conversational user experiences with clean interface design | Brand aesthetics and user engagement through dialogue-style forms | Designers prioritizing visual appeal and response-based pricing flexibility |
| Interact | Quiz-driven lead generation funnels with email platform connectivity | Deep email marketing integrations and audience segmentation capabilities | Marketing professionals building list segmentation workflows |
| Outgrow | Business calculators, assessments, and interactive content types | ROI calculators, maturity assessments, and B2B-focused engagement tools | B2B organizations needing complex calculation-based lead qualification |
| LeadQuizzes | Straightforward quiz construction with analytics integration | Direct CRM connections (GetResponse compatible) and performance tracking | Businesses seeking balanced functionality without excessive complexity |
| ConvertFlow | Multi-tool conversion platform combining quizzes with other lead capture formats | Unified platform offering popups, sticky bars, landing pages, and WordPress integration | WordPress users requiring comprehensive conversion toolkit consolidation |
The platform you choose affects capabilities, integrations, and cost. Match features to your requirements.
Comparison criteria:
- Quiz builder flexibility
- Form customization depth
- Native integrations with email platforms
- Analytics and reporting
- Pricing structure
Typeform excels at conversational experiences. Clean interface, strong brand appeal. Limited branching logic compared to dedicated quiz platforms. Pricing scales with responses.
Interact focuses specifically on quiz funnels. Deep integration with email marketing platforms. Good segmentation features. Better for marketers than designers.
Outgrow handles calculators and assessments alongside quizzes. Strong B2B features. ROI calculators, maturity assessments, savings estimators. Higher learning curve.
LeadQuizzes offers straightforward quiz building with solid analytics. Direct integrations with GetResponse and major CRMs. Good middle ground between simplicity and power.
ConvertFlow combines quizzes with other conversion tools. Popups, sticky bars, landing pages in one platform. WordPress lead generation plugins integrate well with this option.
For basic WordPress forms, simpler solutions exist. Free WordPress form plugins handle standard lead capture without quiz functionality.
Common Mistakes in Quiz Lead Generation
Avoid these errors that kill conversion rates and lead quality.
Asking Too Many Questions
Every question past ten drops completion rates sharply.
Monitor your analytics. Identify exactly where people abandon and cut from there.
The data you could collect matters less than the leads you actually capture.
Weak Value Proposition
Quiz results must deliver genuine insight. Generic outcomes feel like a waste of time.
Personalization depth matters. Results should feel specific to the individual, not a horoscope that applies to everyone.
Actionable recommendations beat vague personality descriptions. Tell people what to do next.
Poor Form Timing
Gating too early loses people who haven’t invested enough to provide their email.
Gating too late gives away all the value before you capture contact information.
Work on improving form abandonment rate by testing different gate positions.
Missing Follow-Up Automation
Leads decay fast. Response within the first hour dramatically increases conversion likelihood.
Build your email sequences before launching the quiz. Test the automation end-to-end.
A quiz that captures emails but sends nothing wastes every lead it generates.
How to Measure Quiz and Form Performance
Track these metrics to identify optimization opportunities.
Completion Rate Tracking
Benchmark: 60-80% of starters should finish your quiz.
Interact 2026 data shows 65% baseline completion rate for quiz starters. Okendo confirms 60% average benchmark across industries.
Short quizzes (3-7 questions): 65-85% completion rate Medium quizzes (8-15 questions): 45-65% completion Long quizzes (16+ questions): 25-45% completion
Below 50%? Questions are too hard, too many, or too personal too early.
Riddle research found embedded quizzes achieve 78.4% average completion versus lower rates for popup quizzes. Seamless integration reduces drop-off.
Real-world performance: Kylie Kelly achieved 86% completion rate (135 leads from 157 starters). Jocko Fuel using Octane AI recorded 90%+ completion. Dashly experiments reached 87% completion through optimization.
Question-level analytics show exactly where drop-off happens. Focus improvements there first.
Completion rate optimization tactics:
First screen critical (highest drop-off):
- Show value proposition clearly
- Set expectations (time + question count)
- Add incentive or bonus reveal
Question count optimization:
- 5-30 questions can achieve similar completion (test for your audience)
- Sweet spot: 7 questions where engagement peaks (Outgrow data)
- Optimal range varies by industry and complexity
Answer format matters:
- Predefined buttons beat text entry (Miller’s Law: 3-7 options maximum)
- Images + text outperform text-only options
- Progress bars increase completion 12-18% (Outgrow)
Mobile optimization essential:
- Mobile quizzes outperform desktop in completion rates
- Mobile-first design critical (60% of quiz traffic from mobile)
- Loading speed: every extra second costs 7% completion rate
Conversion Rate Analysis
Form submission rate measures how many completers provide their email.
Good quizzes hit 50%+ opt-in rates. Some top performers reach 70%.
Interact 2026 benchmark: 40.1% lead conversion rate (consistent from previous year). Best-performing quizzes reach 60% conversion according to lead magnet statistics.
Interactive quizzes convert at 20-40% compared to 2.8% for static forms (Outgrow analysis of 50,000+ forms shows 47.3% vs 2.8%). That’s 16.9X improvement.
Real-world conversion examples:
- Kylie Kelly: 86% conversion (135 leads from 157 starters)
- Sideshow Collectibles: 60% conversion rate
- RANAVAT: 294% conversion increase after implementing quiz
- Equestrian retail brand: 66% registration from 16,000 quiz plays
A/B test gate placement, form fields, and copy to push rates higher. Use form validation best practices to reduce errors.
Email capture optimization:
Gate placement timing:
- Email at question 3-4: 40% completion increase versus start placement (Email Conversion Lab)
- Making email optional increases completions when seeing high drop-off (Okendo)
- Display on results page after investment increases conversion
Form field strategy:
- Reduce fields from 4 to 3: 50% conversion increase (Quicksprout)
- Reduce from 11 to 4 fields: 160% conversion boost
- Each additional field decreases conversion by 4.1% (HubSpot)
Trust signal implementation:
- Social proof above email field: 31% conversion lift
- Privacy statement near submit button reduces hesitation
- Security badges increase conversion by 12.3-15%
Lead Quality Scoring
Not all quiz leads are equal. Track which segments convert to customers.
According to Landbase research, properly scored and qualified leads achieve 40% conversion rates versus 11% for unqualified prospects. Organizations implementing robust lead nurturing generate 50% more sales-ready leads at 33% lower cost.
HubSpot 2024 data shows 43% of sales teams struggle with lack of high-quality leads. Lead quality determines conversion rates, sales cycle length, and ROI.
Engagement depth during the quiz correlates with purchase intent.
RANAVAT case study: 16% of online revenue came from quiz customers. Quiz-sourced leads directly impacted bottom line performance.
Interactive content preferred: 81% of B2B buyers prefer interactive content over static content (2025 research). Interactive experiences grab attention better according to 81% of marketers.
Revenue attribution connects quiz performance to actual business results. This matters more than vanity metrics.
Lead quality measurement framework:
Qualification criteria:
- Completion depth (80% completion shows 102% higher conversion per Obvi)
- Question engagement time (2-4 minutes optimal)
- Answer patterns indicating budget/timeline/authority
- Email domain quality (business vs personal)
Scoring model development:
- AI-driven scoring improves accuracy by 40% versus traditional methods
- Track lead-to-MQL conversion (31% average benchmark)
- MQL-to-SQL rates (13% average benchmark)
- Speed-to-lead response (within 5 minutes = 21X more likely to qualify per Harvard/HubSpot)
Segmentation performance:
- Track conversion by quiz result type
- Monitor which segments produce highest customer lifetime value
- Compare purchase rates across different quiz outcomes
- Identify patterns in high-value customer quiz answers
Attribution tracking:
- Revenue by quiz segment
- Customer acquisition cost by quiz type
- Lifetime value by original quiz result
- Multi-touch attribution showing quiz role in journey
Email Performance Metrics
Open rates by segment reveal which quiz results attract engaged subscribers.
Segmented emails show 14.31% higher open rates and 100.95% higher click rates versus non-segmented according to MoEngage data analyzing 5.3 billion emails.
Quiz-based segmentation enables personalization that improves CTR by 14% and conversions by 10% (Aberdeen Group).
Average email open rate across industries: 42.35% (2025 benchmark). Welcome emails delivering quiz results achieve 91.43% open rate.
Click rates by quiz outcome show which segments respond to your content.
Lead nurture emails generate 8% CTR versus 3% for general sends. Response rates on nurture emails run 4-10X higher than broadcast emails.
Compare quiz-sourced leads against other lead generation strategies to measure relative performance.
When analyzing survey data from post-purchase surveys, cross-reference with original quiz segments to identify your highest-value lead sources.
Email performance tracking by segment:
Segment-specific metrics:
- Open rate by quiz result type (identify most engaged segments)
- Click-through rate by pain point category
- Conversion rate by budget indicator
- Unsubscribe rate by segment (quality signal)
Engagement scoring:
- Email opens + clicks in first 7 days
- Content downloads by segment
- Product page visits from email clicks
- Reply rates to nurture sequences
Revenue correlation:
- Purchase rate by original quiz segment
- Average order value by quiz result
- Repeat purchase rate by segment
- Customer lifetime value by quiz outcome
Benchmark comparisons:
- Quiz leads vs organic search leads
- Quiz leads vs paid advertising leads
- Quiz leads vs social media leads
- Direct sales attribution showing quiz ROI (28.6% track revenue as primary metric per Databox)
Key performance dashboard metrics:
Primary metrics:
- Completion rate (target: 60-80%, top performers: 85-90%)
- Lead conversion rate (target: 40-50%, top performers: 60-86%)
- Email opt-in rate (benchmark: 40.1%, goal: 50%+)
- Cost per qualified lead
Engagement metrics:
- Average completion time (2-4 minutes optimal)
- Drop-off rate by question
- Mobile vs desktop performance
- Traffic source conversion rates
Quality metrics:
- Lead-to-customer conversion by segment
- Revenue per quiz lead
- Customer acquisition cost
- Lifetime value by quiz result
Comparative metrics:
- Quiz leads vs other sources (conversion, quality, revenue)
- Segment performance rankings
- Channel attribution showing quiz impact
- ROI calculation (revenue generated divided by quiz creation/promotion costs)
FAQ on How to Use Quizzes and Interactive Forms
What is a lead generation quiz?
A lead generation quiz is interactive content that asks visitors questions, collects their email address, and delivers personalized results. Unlike static forms, quizzes engage users while gathering data about preferences and pain points for audience segmentation.
How many questions should a lead generation quiz have?
Keep quizzes between 6-10 questions. The three-minute rule applies: anything longer kills completion rates. Track your analytics to identify where people drop off and cut questions accordingly.
Where should I place the email capture form in my quiz?
Place the lead capture form after all questions but before revealing results. This timing maximizes leverage because visitors invested time answering and want their personalized outcome.
What types of quizzes work best for B2B companies?
Assessment quizzes and diagnostic quizzes perform strongest for B2B. Maturity assessments, ROI calculators, and readiness evaluations attract prospects actively seeking to understand their current situation against benchmarks.
How do interactive forms differ from regular forms?
Interactive forms respond to user input in real time using conditional logic. Fields appear or hide based on previous answers, creating a personalized experience that feels conversational rather than like filling out paperwork.
What conversion rates should I expect from quiz funnels?
Well-designed quiz funnels achieve 30-50% opt-in rates. Top performers reach 70%. Compare this to traditional pop-up forms averaging under 3%. The engagement difference drives dramatically higher conversions.
Which quiz builder tools integrate with email marketing platforms?
Typeform, Interact, Outgrow, and LeadQuizzes offer native integrations with HubSpot, ActiveCampaign, Mailchimp, Klaviyo, and Salesforce. Zapier connects platforms without direct integrations for flexible marketing automation workflows.
How do I segment leads based on quiz answers?
Map each quiz result to specific email list tags or CRM segments. Your quiz builder pushes answer data to your email marketing platform automatically, triggering different welcome sequences based on responses.
Should I use multi-step forms or single-step forms?
Multi-step forms or single-step forms depends on data needs. Multi-step forms increase completion rates by 20-30% for longer forms. Single-step works fine when collecting only email and name.
How quickly should I follow up with quiz leads?
Immediately. Send quiz results via email within minutes of submission. Leads decay fast; response within the first hour dramatically increases conversion likelihood compared to delayed follow-up sequences.
Conclusion
Mastering how to use quizzes and interactive forms for lead generation gives you a competitive edge most businesses ignore.
The data speaks clearly. Quiz funnels outperform traditional opt-in methods by 10-25x on conversion rates.
Beyond raw numbers, you gain something more valuable: deep audience insights. Every quiz response reveals buyer personas, pain points, and purchase readiness without manual research.
Start simple. Build one assessment quiz or product recommendation quiz using Interact or Outgrow. Connect it to your email marketing platform. Set up segmented follow-up sequences.
Test different question flows, gate placements, and result categories.
The brands winning at lead capture today treat interactive content as a core channel, not an experiment. Your email list growth depends on making that same shift.