

A blank quiz builder staring back at you is where most people quit. The questions feel off, the scoring logic gets confusing, and the whole thing takes three times longer…
Table of Contents
Most surveys fail before a single response comes in. The problem is almost always the questions.
Likert scale questions are the most common format in survey research, used across customer satisfaction programs, employee engagement surveys, and academic studies. But writing good ones is trickier than it looks. A poorly worded item, a missing midpoint, or a double-barreled question can quietly wreck your data.
This guide covers practical examples of Likert scale questions for surveys across multiple industries and use cases. You’ll find ready-to-use question templates for agreement, satisfaction, frequency, likelihood, and importance scales, along with guidance on choosing between five-point and seven-point formats, avoiding common design mistakes, and analyzing the results once the responses are in.
What Is a Likert Scale Question?
A Likert scale question is a closed-ended survey item that measures how strongly someone agrees, disagrees, or feels about a statement. Respondents pick from a set of ordered response options, typically ranging from “Strongly Disagree” to “Strongly Agree.”
Psychologist Rensis Likert created this format in 1932 as a way to turn attitudes into numbers. Before his work, researchers had limited tools for measuring opinion intensity beyond simple yes-or-no answers.
The most common formats are five-point and seven-point scales. A five-point scale uses options like Strongly Disagree, Disagree, Neutral, Agree, and Strongly Agree. A seven-point version adds finer distinctions (Somewhat Agree, Somewhat Disagree) between those anchors.
Research from MeasuringU confirms that seven-point scales offer slightly better measurement accuracy than five-point versions, though the difference is modest. The psychometric research suggests diminishing returns beyond about 11 scale points.
How does a Likert scale differ from other rating methods? A semantic differential scale places two opposing adjectives at each end (like “Easy” and “Difficult”) and asks respondents to mark a point between them. A visual analog scale uses a continuous line instead of fixed points. Likert items use labeled categories, which makes them faster for respondents and simpler to analyze.
One thing that trips up a lot of survey designers: there’s actually a difference between a Likert item and a Likert scale. A single question is an item. A scale is a group of items combined into a composite score. The Journal of Graduate Medical Education notes this matters because single items may not fully capture complex concepts like job satisfaction or patient confidence. Grouping multiple items and testing reliability with Cronbach’s alpha gives you a stronger measurement.
And yes, it’s pronounced “LICK-ert,” not “LIKE-ert”. Most people get that wrong.
Types of Likert Scale Response Formats
Not all Likert scale questions use the agree-disagree format. The response options you pick should match what you’re actually trying to measure. Here’s a breakdown of the most common formats and where they fit best.
Agreement Scales
The default choice for most surveys. Agreement scales work well when you want to test how people react to a specific statement. “I feel supported by my direct manager” or “This product meets my needs” are typical examples.
Gallup’s Q12 employee engagement survey, used across thousands of organizations worldwide, relies heavily on agreement-based items. Their 2025 report found that global employee engagement dropped to 21% in 2024, a decline measured entirely through this type of question format.
Satisfaction Scales
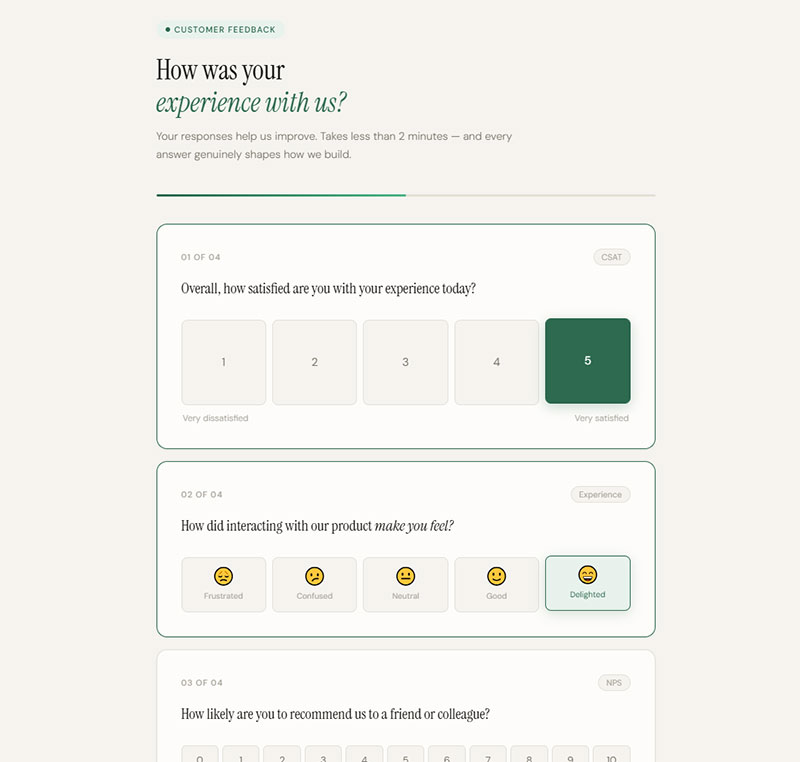
These work best when the question is about an experience rather than a belief. Customer satisfaction (CSAT) surveys typically use a 1-5 satisfaction scale, and the American Customer Satisfaction Index reports average scores between 75% and 85% across industries.
Satisfaction scales pair naturally with other metrics. Many teams run CSAT alongside Net Promoter Score surveys to get both a snapshot of current satisfaction and a read on future loyalty. If you’re collecting this kind of feedback through survey questions, matching the scale to the touchpoint matters more than the number of points you offer.
Frequency Scales
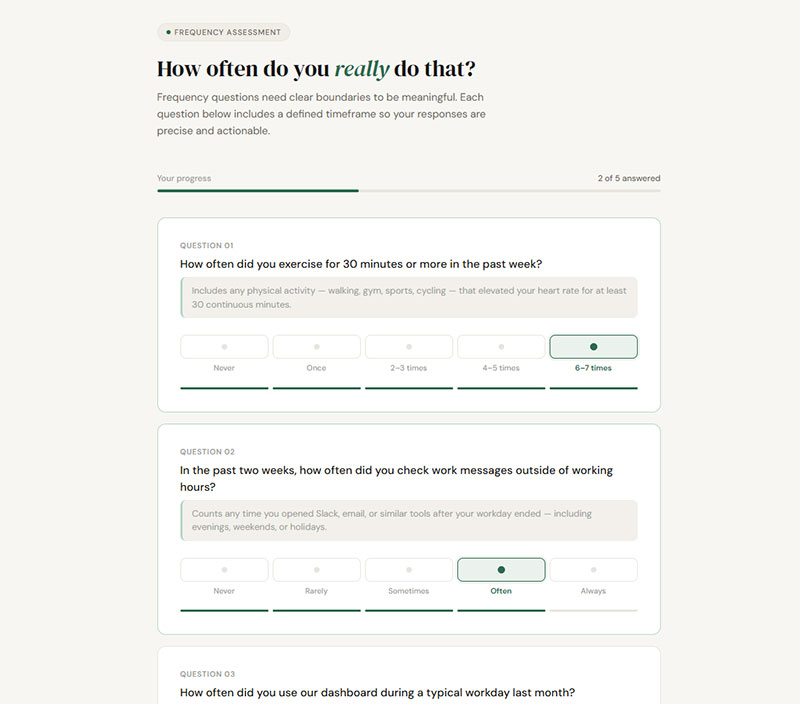
When you need to measure how often something happens, not how someone feels about it. Options range from “Never” to “Always,” sometimes with specific time anchors like “Once a week” or “Several times a day.”
Frequency questions need clear boundaries. “How often do you exercise?” is vague. “How often did you exercise for 30 minutes or more in the past week?” is measurable. Without defined timeframes, respondents interpret frequency labels differently, and your data gets muddy.
Likelihood and Importance Scales
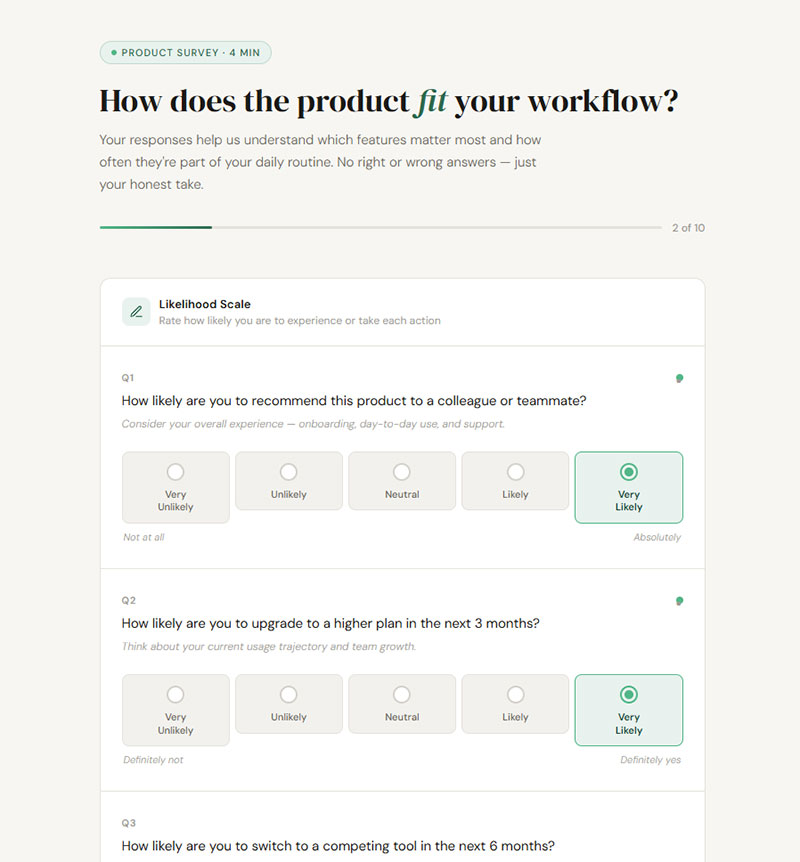
Likelihood: Measures intent. “How likely are you to recommend this product?” or “How likely are you to renew your subscription in the next 90 days?” This format is the backbone of NPS-adjacent surveys across SaaS and retail.
Importance: Measures priority. Product teams use these to rank feature requests. Hospitality brands pair importance items with satisfaction items to run gap analysis (importance-performance mapping). If customers rate “fast checkout” as highly important but rate their satisfaction with it as low, that’s your signal.
Agreement-Based Likert Scale Question Examples
Agreement questions are the workhorse of survey design. They’re flexible enough to cover employee engagement, customer perception, and training evaluation. But they fall apart fast when you write them poorly.
The biggest mistake? Double-barreled questions. “I feel valued by my manager and supported by my team” asks two things at once. If someone agrees with one part but not the other, the response is meaningless. Every item should cover one concept only.
Employee Engagement Survey Examples
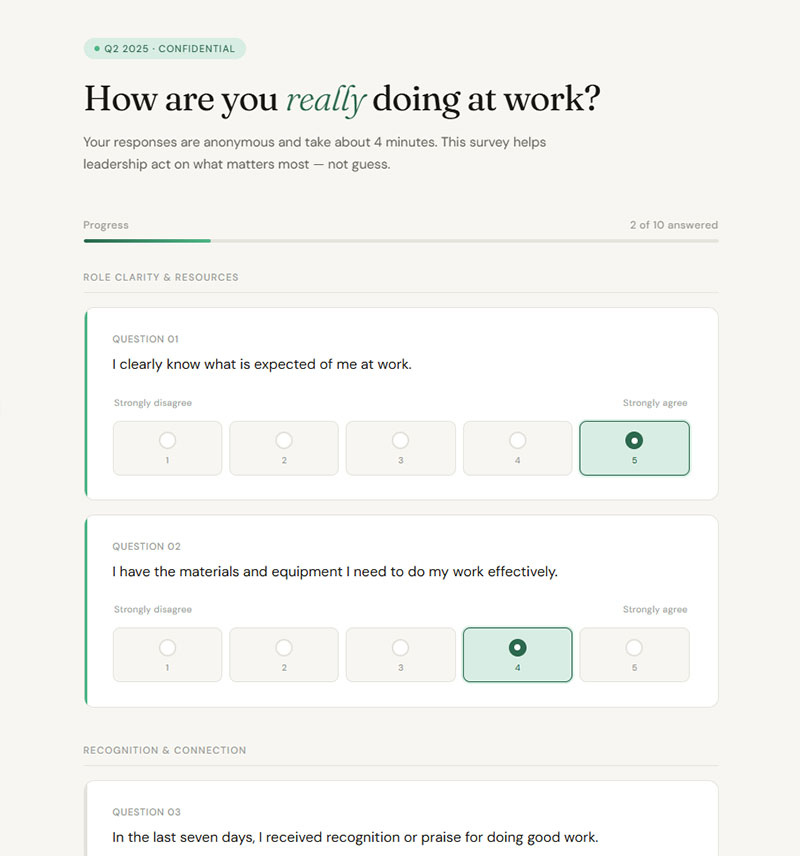
Gallup’s annual data paints a stark picture. U.S. employee engagement fell to 31% in 2024, the lowest in a decade. Only 46% of employees said they clearly know what’s expected of them at work, down 10 points from 2020.
These findings come directly from agreement-based Likert items. Here are examples modeled after the patterns that drive real engagement research:
- “I have the materials and equipment I need to do my work effectively.” (Strongly Disagree to Strongly Agree)
- “In the last seven days, I received recognition for doing good work.”
- “My opinions seem to count at work.”
- “I have opportunities to learn and grow in my current role.”
Georgia Tech used the Gallup Q12 survey in 2024 to benchmark faculty and staff engagement against other higher education institutions, proving these question formats work across sectors, not just corporate settings.
If you’re building employee satisfaction survey questions, keep each item focused on a single observable behavior or experience. Abstract statements like “I am engaged at work” don’t give you anything to act on.
Customer Feedback Survey Examples
Forrester’s 2024 CX Index found that U.S. customer satisfaction declined for the third straight year, with 9 out of 13 industries seeing drops. Agreement scales help you identify exactly where the breakdown happens.
Useful customer-facing Likert items include:
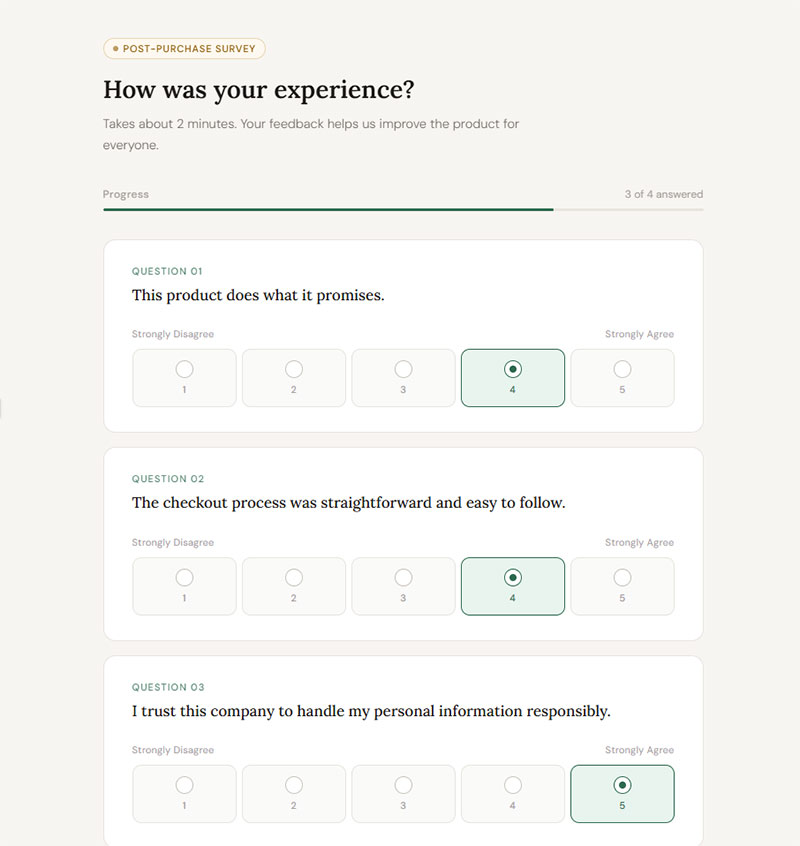
- “This product does what it promises.” (Strongly Disagree to Strongly Agree)
- “The checkout process was straightforward and easy to follow.”
- “I trust this company to handle my personal information responsibly.”
One thing I’ve noticed: companies that embed these questions at specific touchpoints (post-purchase, post-support, post-onboarding) get far better signal than companies that blast a generic annual survey. If you’re running post-purchase survey questions, timing matters as much as question design.
Education and Training Survey Examples
Course evaluations and training assessments rely on the same structure. The goal is to measure whether the learning experience actually worked, not just whether people liked the instructor.
Training effectiveness items:
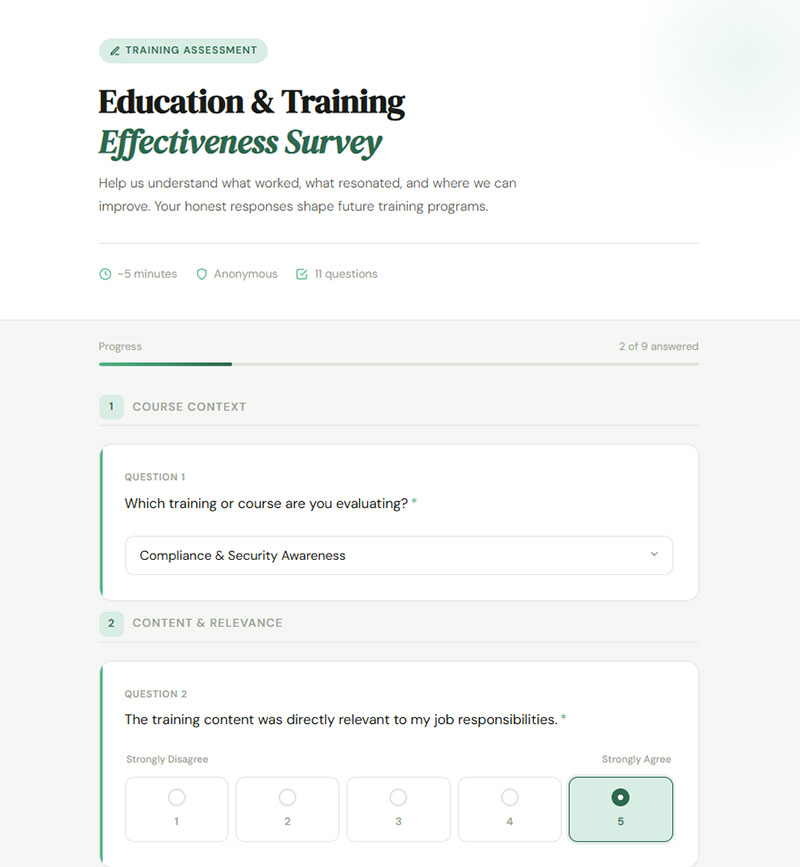
- “The training content was directly relevant to my job responsibilities.”
- “I can apply what I learned in this course to my daily work.”
- “The instructor demonstrated strong knowledge of the subject matter.”
For organizations that run post-training surveys through platforms like Qualtrics or Google Forms, combining agreement items with one or two open-ended questions gives you both the quantitative trend and the specific context behind it. Looking at different types of survey questions and mixing them is usually smarter than going all-Likert.
Satisfaction-Based Likert Scale Question Examples
Satisfaction scales measure experience quality, not belief. They work best immediately after an interaction, when the memory is fresh and the respondent can give you an honest read.
The standard CSAT calculation takes the number of “Satisfied” and “Very Satisfied” responses, divides by total responses, and multiplies by 100. The average CSAT score across industries typically lands between 75% and 85%, according to the American Customer Satisfaction Index.
Customer Satisfaction Examples
SurveySparrow’s 2025 benchmark data shows that survey response rates in 2025 typically fall between 5% and 30%, with short surveys of 1-3 questions hitting completion rates as high as 83%. That’s a strong argument for keeping your satisfaction survey tight.
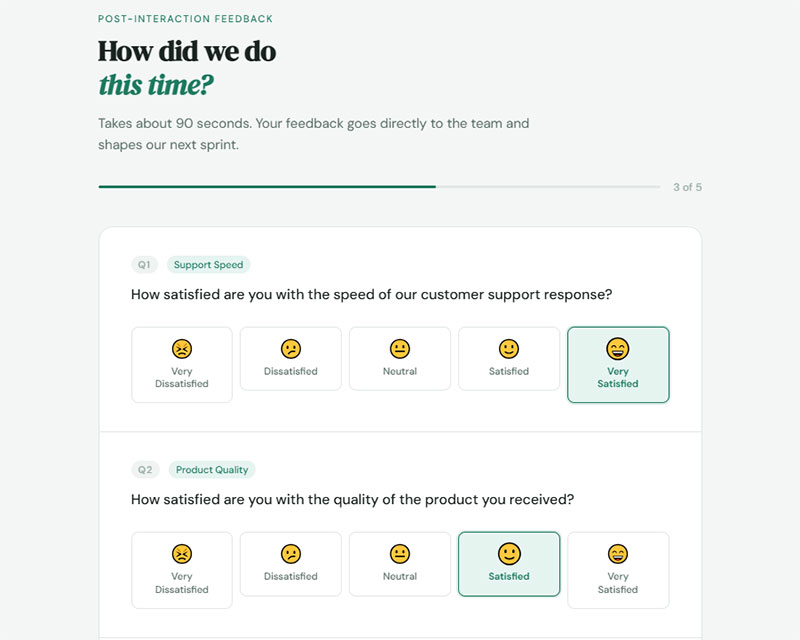
Examples that work in real CSAT programs:
- “How satisfied are you with the speed of our customer support response?” (Very Dissatisfied to Very Satisfied)
- “How satisfied are you with the quality of the product you received?”
- “How satisfied are you with the overall value for the price you paid?”
Retently’s 2025 CSAT benchmark shows B2B SaaS companies averaging scores in the high 70s, while consulting firms hit around 84. Communication and media sits at just 22. If your score falls below your industry average, the fix usually isn’t the survey itself. It’s the experience.
When building out customer satisfaction survey templates, keep items transactional. Ask about what just happened, not about the brand overall.
Healthcare and Patient Experience Examples
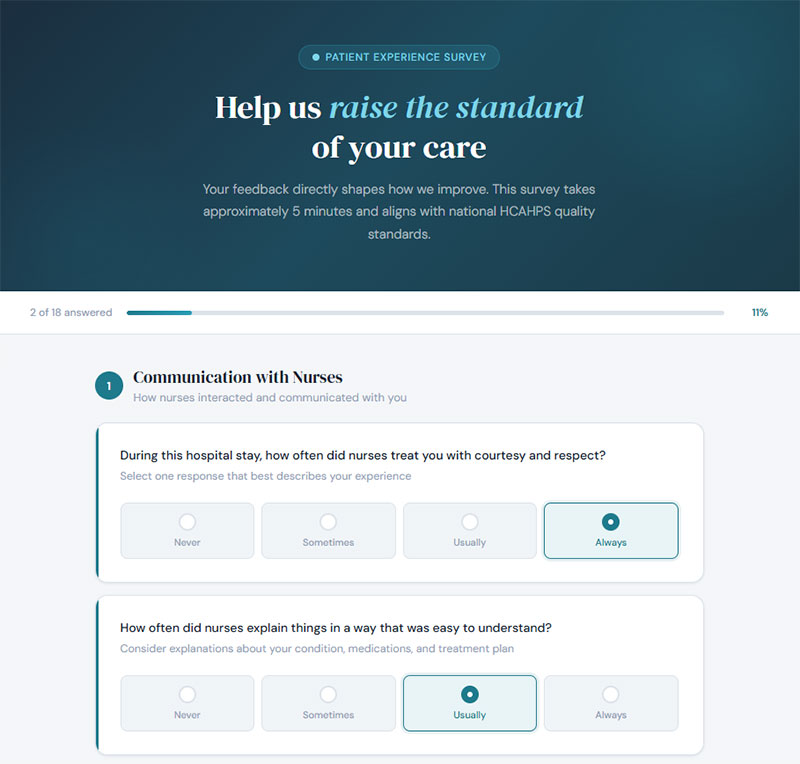
The HCAHPS survey is the gold standard for patient satisfaction measurement in the United States. Over 4,400 hospitals participate, and nearly two million patients complete it each year. CMS made significant updates to the survey in January 2025, expanding it to 32 items that cover 11 measures of patient experience.
HCAHPS uses a mix of frequency and satisfaction response formats. Questions cover communication with nurses and doctors, responsiveness of staff, discharge information, and overall hospital rating.
Patient satisfaction Likert items for clinic or outpatient settings might look like:
- “How satisfied were you with the wait time before your appointment?” (Very Dissatisfied to Very Satisfied)
- “How satisfied were you with the clarity of your treatment explanation?”
- “How satisfied were you with the follow-up communication after your visit?”
Definitive Healthcare data from January 2024 found that only three U.S. states (South Dakota, Minnesota, Wisconsin) had average HCAHPS scores above a 4-star rating. That’s a lot of room for improvement across the healthcare system.
Frequency-Based Likert Scale Question Examples
Frequency scales track behavior, not opinion. They’re the right choice when you need to know how often something actually happens rather than how someone feels about it.
The usual anchors: Never, Rarely, Sometimes, Often, Always. Some surveys swap in specific timeframes (“Once a month,” “2-3 times per week”) for better precision. Your mileage may vary, but I’ve found that labeled frequency options without time anchors lead to inconsistent interpretation across respondents.
Workplace Behavior Examples
Sample items for HR and management surveys:
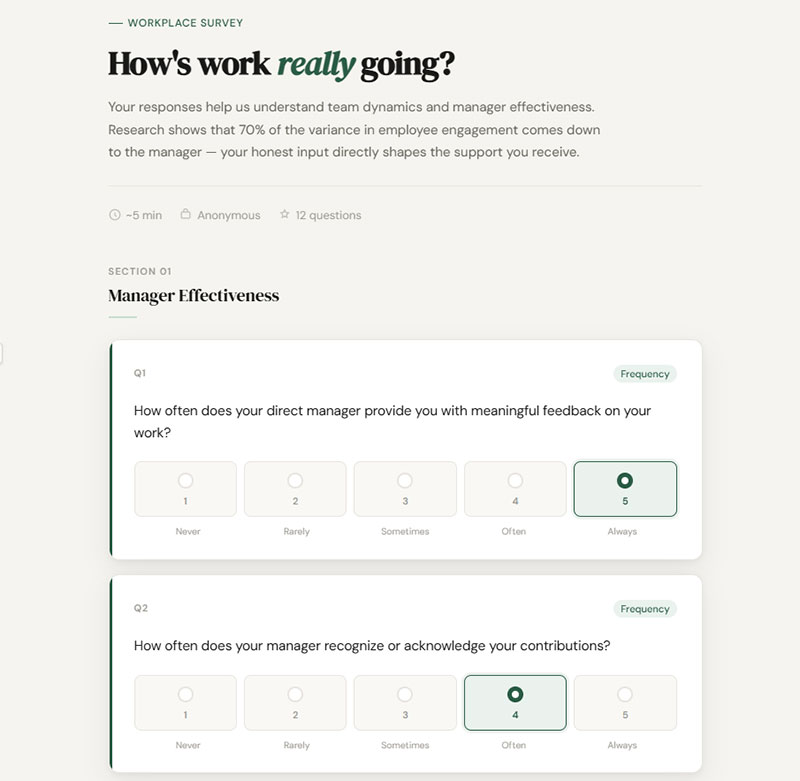
- “How often does your direct manager provide you with feedback on your work?” (Never to Always)
- “How often do you feel included in team decisions that affect your role?”
- “How often do you experience unclear expectations about your responsibilities?”
Gallup’s 2025 findings showed that 70% of the variance in employee engagement comes down to the manager. Frequency questions about manager behavior, like how often feedback happens or recognition is given, give HR teams a direct line to the root cause of disengagement.
Pair these with your onboarding survey questions to track whether new hires receive adequate support during their first 90 days.
Health and Wellness Survey Examples
Frequency items for health-related surveys need tight time anchors. Otherwise, “sometimes” means something completely different to a daily runner than to someone who exercises once a month.
Better-framed frequency questions:
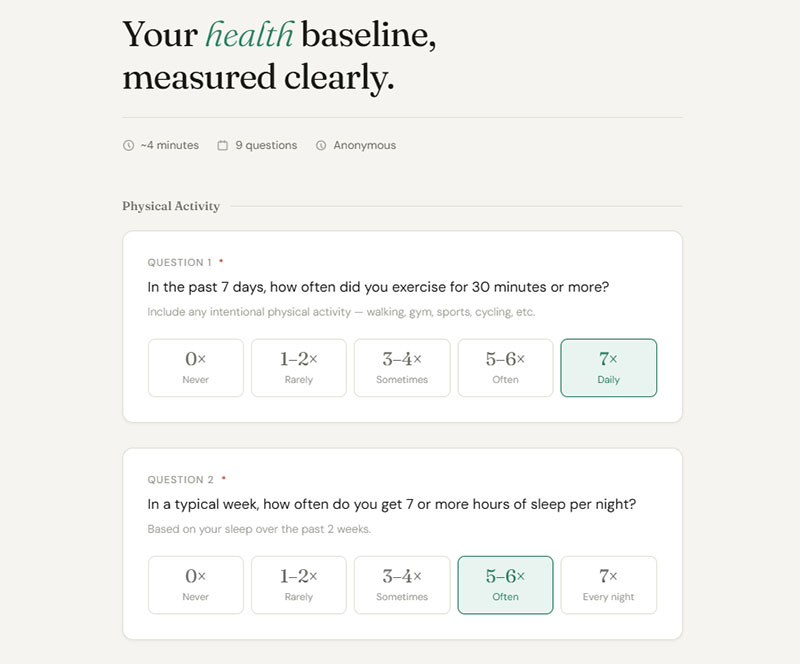
- “In the past 7 days, how often did you exercise for 30 minutes or more?”
- “In a typical week, how often do you feel overwhelmed by stress at work?”
- “How frequently do you skip meals during a typical workday?”
A good approach is to anchor one end to a specific count (Never, 1-2 times, 3-4 times, 5+ times) rather than relying on vague labels. This works especially well in wellness program evaluations where you need trackable baselines over time.
Product Usage Frequency Examples
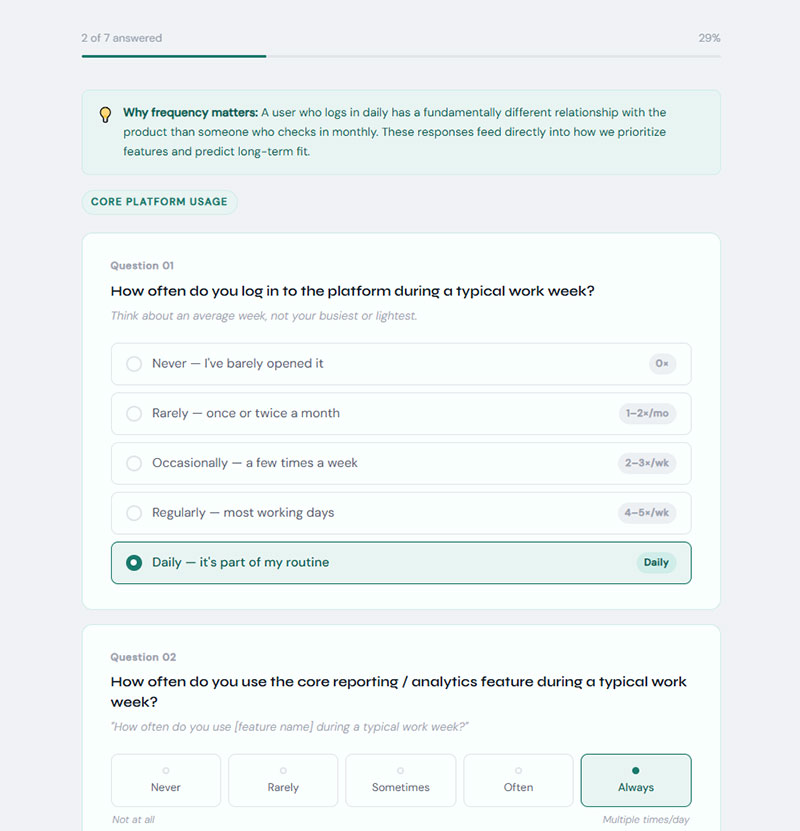
SaaS and product teams use frequency questions to understand adoption depth. A user who logs in daily has a completely different relationship with your product than someone who checks in once a month.
- “How often do you use [feature name] during a typical work week?”
- “How frequently do you refer to our help documentation when using the product?”
These questions feed directly into product analytics and churn prediction models. If you’re also running website usability survey questions, combining frequency data with satisfaction ratings gives you a two-dimensional view of the user experience.
Likelihood and Intent Likert Scale Question Examples
Likelihood scales measure what someone says they’ll do next. Purchase intent, recommendation probability, renewal decisions. These questions project forward instead of reflecting backward.
The catch? There’s always a gap between what people say and what they actually do. Stated intent runs higher than real-world behavior. But tracked over time, shifts in likelihood scores are strong predictors of changing customer sentiment, even if the absolute numbers are inflated.
Purchase Intent Examples
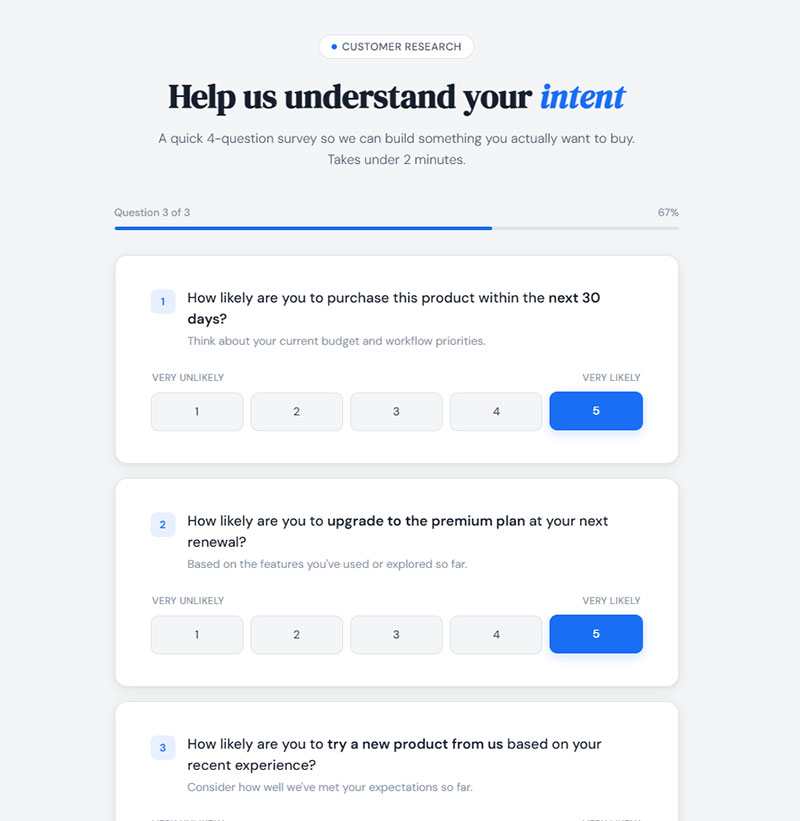
Likelihood items for purchase intent typically use a five-point or seven-point scale from “Very Unlikely” to “Very Likely.” The key is adding a timeframe. Without one, you’re measuring a vague feeling, not actionable intent.
- “How likely are you to purchase this product within the next 30 days?” (Very Unlikely to Very Likely)
- “How likely are you to upgrade to the premium plan at your next renewal?”
- “How likely are you to try a new product from this brand based on your recent experience?”
Forrester reports that customer-obsessed organizations achieve 49% faster profit growth and 51% better retention than their peers. Likelihood items are one of the simplest ways to spot whether your customers are trending toward loyalty or toward your competitor’s checkout page.
Recommendation Likelihood Examples
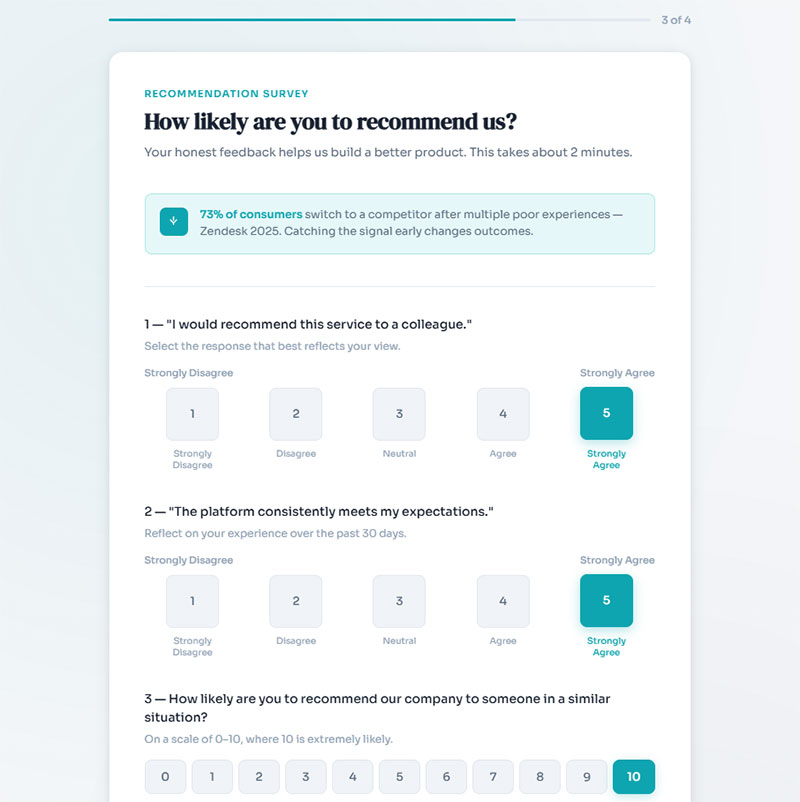
The Net Promoter Score format (“How likely are you to recommend us to a friend or colleague?” on a 0-10 scale) is the most recognized version of a likelihood question. But you can also use standard five-point or seven-point Likert versions for internal benchmarking.
Likert-adapted recommendation questions:
- “I would recommend this service to a colleague.” (Strongly Disagree to Strongly Agree)
- “How likely are you to recommend our company to someone in a similar situation?”
Zendesk’s 2025 data shows that 73% of consumers will switch to a competitor after multiple bad experiences. Recommendation questions catch the drift before it becomes a churn event. When designing NPS survey questions, pair the numeric score with an open-ended follow-up to understand the “why” behind the number.
Behavioral Intent in HR Contexts
Retention-focused HR teams use likelihood items to predict turnover before it shows up in resignation letters.
- “How likely are you to still be working at this organization 12 months from now?”
- “How likely are you to recommend this company as a good place to work?”
HR Dive reported that U.S. employee engagement hit a decade-low of 31% at the end of 2024. Gen Z workers and women appeared most likely to leave. Likelihood questions, when tracked quarterly, give you the early warning signal that annual engagement surveys often miss.
If you want to go beyond pulse surveys and create more structured approaches that avoid survey fatigue, mix likelihood items with a few targeted open-text questions rather than stacking 40 Likert items in a row.
Importance-Based Likert Scale Question Examples
Importance scales answer a different question than satisfaction or agreement formats. They tell you what matters most to your audience, not how they feel about what you’re already doing.
The typical anchors run from “Not at All Important” to “Extremely Important” on a five-point or seven-point scale. Product teams use them to prioritize features. Hospitality brands use them to figure out which service attributes customers actually care about versus which ones are just nice to have.
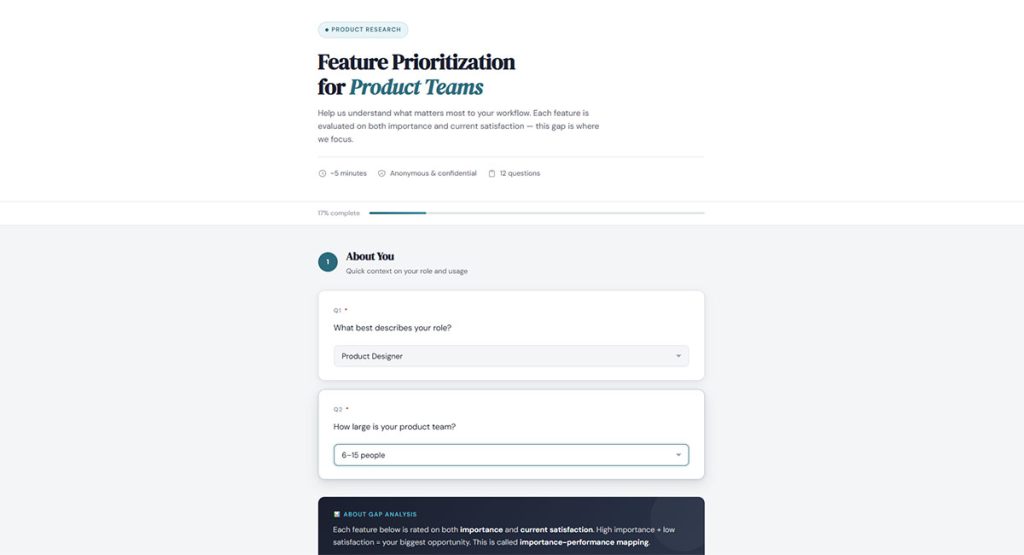
Feature Prioritization for Product Teams
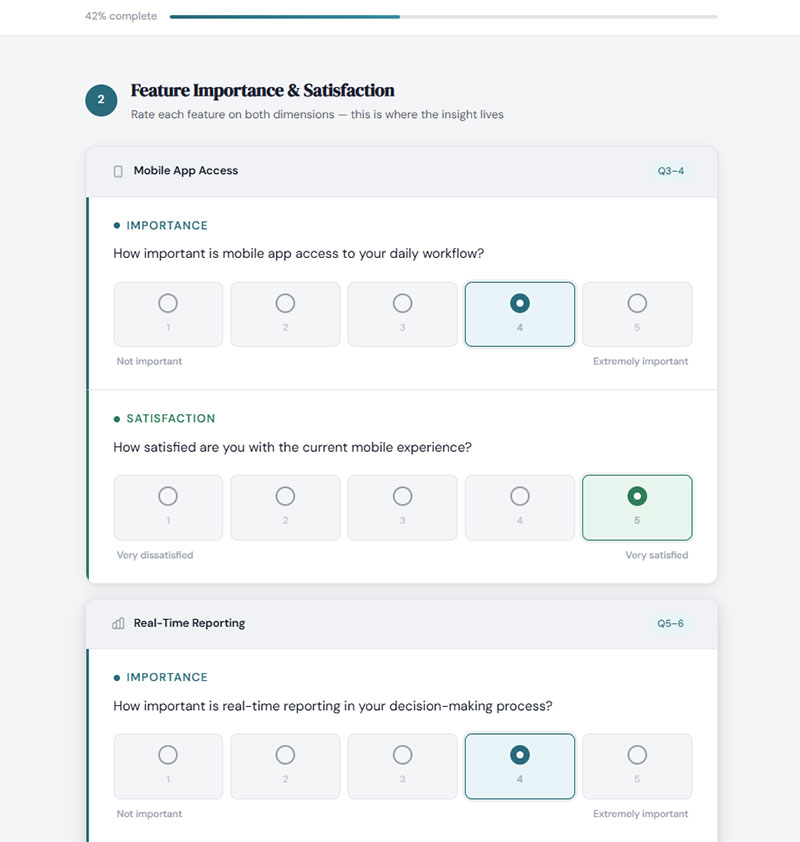
The real value here is gap analysis. When you pair importance items with satisfaction items on the same attributes, you get what researchers call importance-performance mapping. High importance plus low satisfaction equals your biggest opportunity.
- “How important is mobile app access to your daily workflow?” (Not Important to Extremely Important)
- “How important is real-time reporting in your decision-making process?”
- “How important is integration with your existing tools when evaluating new software?”
Qualtrics and SurveyMonkey both offer built-in templates that pair importance and satisfaction scales side by side. If you’re building your own survey form templates, structure each attribute as two questions: one for importance, one for satisfaction.
Service Attribute Importance for Retail and Hospitality
The American Customer Satisfaction Index tracks satisfaction across dozens of industries, but importance data is what tells you where to focus your budget. A hotel guest who rates “room cleanliness” as extremely important but gives it a mediocre satisfaction score is telling you something very specific.
Sample importance items:
- “How important is staff friendliness to your overall experience at our hotel?”
- “How important is checkout speed when shopping at a retail store?”
When collecting this data through web forms, keep the scale consistent across all attributes so respondents can compare items against each other. Switching between a 5-point and 7-point format mid-survey confuses people and produces inconsistent data.
How to Write Effective Likert Scale Questions
Bad questions produce bad data. And with Likert items, the mistakes are often subtle enough that you won’t notice until the results make no sense.
Lensym research found that acquiescence bias (the tendency to agree regardless of actual opinion) inflates agreement rates by 10-15% on typical agree-disagree scales. Pew Research ran an experiment where simply changing “welfare” to “assistance to the poor” produced a 21-point swing in responses. Question wording matters more than most survey designers think.
Common Mistakes That Skew Results
Double-barreled questions: “I feel valued by my manager and supported by my peers” measures two things. If someone agrees with one but not the other, the response is garbage.
Leading language: “Don’t you agree that our customer support is excellent?” pushes toward a positive response. Neutral phrasing like “How would you rate your experience with our customer support team?” gives you cleaner data.
Missing midpoint: Forcing a four-point or six-point scale without a neutral option creates false polarization. Some researchers prefer it to avoid fence-sitting, but most psychometric research supports including a true midpoint for honest responses.
Research by Jon Krosnick shows that labeling every scale point (not just endpoints) improves response quality. People process labeled anchors more consistently than numbered-only scales.
When designing these items for a survey form, keep a few of these best practices for creating feedback forms in mind: one concept per question, balanced scales, and simple language at an appropriate reading level.
Choosing Between Five-Point and Seven-Point Scales
Finstad’s research on usability inventories found that five-point scales may lack the sensitivity to capture a respondent’s true evaluation. Seven-point versions recorded more accurate assessments while staying compact enough for practical use.
But the psychometric literature (Nunnally, 1978) also shows diminishing returns past about 11 points. Seven hits the sweet spot between precision and simplicity for most survey contexts. Five works fine for mobile forms where screen space is tight and you need fast responses.
How to Analyze Likert Scale Data
Collecting responses is only half the job. The other half is making sense of what people told you, and that’s where a lot of teams get tripped up.
The central debate in Likert data analysis is whether the data is ordinal (ranked categories) or can be treated as interval (evenly spaced numbers). This matters because it determines which statistical tests are valid. The Journal of Graduate Medical Education reviewed this controversy and concluded that parametric tests can be used with Likert data, especially with adequate sample sizes and near-normal distributions.
Single Item Analysis vs. Composite Scale Scores
A single Likert item (one question) is technically ordinal. The mode or median is a better measure of central tendency than the mean. What does the “average” of “Never” and “Rarely” actually mean? Not much.
Composite scales change the picture. When you sum or average multiple related items into one score, the central limit theorem kicks in and the data behaves more like interval data. Most researchers recommend a minimum of four to eight items in a composite before treating the results as continuous.
Before combining items, test reliability. Cronbach’s alpha is the standard measure here. A value of 0.7 or higher is generally considered acceptable, though some fields set stricter thresholds. Values above 0.95 may signal redundancy, meaning your questions are too similar to add unique information.
Tools: SPSS remains the most widely used software for Likert analysis in social science and education research. R (especially the psych and likert packages) gives you more flexibility and it’s free. Google Sheets and Excel handle basic descriptive statistics and are good enough for internal team surveys that don’t require statistical testing.
For visualization, diverging stacked bar charts are the gold standard for Likert data. Robbins and Heiberger (the researchers who popularized this approach) recommend them over standard bar charts because they make it easy to see the distribution of agreement and disagreement at a glance. If you’re analyzing survey data for a presentation, these charts communicate patterns faster than any table.
Likert Scale Question Templates by Industry
Copy-ready templates organized by field. Each set uses the response format that fits the industry context best. Adjust the scale (five-point or seven-point) based on your audience and survey length.
SaaS and Product Feedback Templates
SaaS companies live and die by user retention. Retently’s 2024 data shows the average CSAT for B2B SaaS sits around 78%, making it one of the most competitive sectors for satisfaction. These templates target the moments that matter most in the product lifecycle.
Agreement scale (Strongly Disagree to Strongly Agree):
- “This product makes my daily workflow more efficient.”
- “I can find what I need in the help documentation without contacting support.”
- “The onboarding process prepared me to use the product independently.”
Satisfaction scale (Very Dissatisfied to Very Satisfied):
- “How satisfied are you with the speed and performance of the application?”
- “How satisfied are you with the frequency and quality of product updates?”
If you’re pairing Likert items with other data collection methods, combining them with survey questions about product quality gives you both structured ratings and specific quality insights.
HR and Employee Experience Templates
Gallup’s 2025 data shows global employee engagement dropped to 21%, with U.S. engagement at a decade-low 31%. These templates target the specific drivers that Gallup’s Q12 framework identifies as predictive of engagement, adapted for standard five-point Likert format.
For organizations running these surveys through WordPress, WordPress survey plugins like WPForms or Formidable Forms support matrix-style Likert grids that let employees rate multiple statements on a single page.
Mix in a few training survey questions if you’re evaluating specific programs, and add open-ended follow-ups to capture the context behind low scores.
Education and Course Evaluation Templates
Course evaluations are one of the oldest applications of Likert-scale measurement. The format works here because students can rate multiple dimensions of a course quickly without needing specialized knowledge.
Five-point agreement items for course evaluation:
- “The learning objectives for this course were clearly stated from the beginning.”
- “The instructor encouraged questions and class discussion.”
- “The assessments in this course accurately reflected the material taught.”
- “I would recommend this course to another student in my program.”
These templates should be tested for reliability before widespread deployment. A Cronbach’s alpha check across all items measuring “instructor effectiveness” or “course content” ensures your grouped items actually hold together as a coherent scale.
If your institution uses feedback form templates across departments, standardize the Likert anchors so responses can be compared across courses and instructors. Consistency in scale labels is more important than most administrators realize.
For evaluations tied to specific events like workshops or seminars, adapt these into post-event survey questions that capture both the content quality and the logistical experience.
FAQ on Likert Scale Questions
What is a Likert scale question in a survey?
A Likert scale question is a closed-ended survey item where respondents rate their level of agreement, satisfaction, or frequency on a symmetric scale. The most common format uses five or seven ordered response options, from “Strongly Disagree” to “Strongly Agree.”
How many points should a Likert scale have?
Five-point and seven-point scales are the most widely used. Research from Nunnally shows diminishing returns past 11 points. A five-point scale works for quick surveys. Seven points offer more precision for academic or detailed research contexts.
What are examples of Likert scale response options?
Common response formats include agreement (Strongly Disagree to Strongly Agree), satisfaction (Very Dissatisfied to Very Satisfied), frequency (Never to Always), and likelihood (Very Unlikely to Very Likely). Each format matches a different survey measurement goal.
Can Likert scale data be treated as interval data?
Single Likert items are technically ordinal. But when you combine multiple items into a composite score, the data behaves more like interval data. The Journal of Graduate Medical Education confirms parametric tests work with adequate sample sizes.
What is the difference between a Likert item and a Likert scale?
A Likert item is one single question. A Likert scale combines multiple related items into a summated rating that measures an underlying construct. Rensis Likert originally designed the format as a multi-item psychometric scale, not a standalone question.
How do you avoid bias in Likert scale questions?
Mix positively and negatively worded items to reduce acquiescence bias. Avoid leading language, double-barreled questions, and extreme phrasing. Label every scale point, not just endpoints. Pew Research found that small wording changes can swing responses by over 20 points.
Should a Likert scale include a neutral midpoint?
Most psychometric research supports including a neutral option. Removing it forces respondents to pick a side when they may genuinely feel neutral. A balanced scale with a true midpoint produces more honest, less polarized data in most survey contexts.
What tools can analyze Likert scale survey data?
SPSS is the standard in academic and social science research. R offers free, flexible analysis through packages like psych and likert. For simpler internal surveys, Google Sheets or Excel handle basic descriptive statistics like median, mode, and frequency distributions.
How many Likert items should a survey include?
It depends on what you’re measuring. For a single construct like customer satisfaction, four to eight items create a reliable composite score. Surveys with 1-3 questions see completion rates around 83%, so shorter is almost always better for response quality.
What industries use Likert scale questions most?
Healthcare (HCAHPS), human resources (Gallup Q12), SaaS product feedback, higher education course evaluations, and market research all rely heavily on Likert formats. The scale works anywhere you need to quantify attitudes, opinions, or satisfaction levels at scale.
Conclusion
Good examples of Likert scale questions for surveys share the same DNA: one concept per item, balanced response options, and language that doesn’t push respondents toward a particular answer. Get those right and your data becomes something you can actually act on.
Whether you’re measuring employee engagement with agreement scales, tracking customer satisfaction through CSAT programs, or running course evaluations in higher education, the format stays the same. What changes is the response anchors and the context.
Pick the right scale points for your audience. Label every anchor. Test reliability with Cronbach’s alpha before combining items into composite scores.
Run a pilot with a small group before going wide. Check for acquiescence bias and double-barreled items. Then analyze with the right statistical methods, whether that’s median and mode for single items or ANOVA for summated scales.
The Likert format has held up since 1932 for a reason. It works. Your job is to make sure the questions do too.