
Most lead magnets don’t work. They get downloaded, skimmed for 30 seconds, and forgotten. Meanwhile, your email list fills up with people who will never buy anything. The problem isn’t…
Table of Contents
Your next customer is probably within a few miles of your business right now, searching for exactly what you offer.
The question is whether they’ll find you or your competitor.
Lead generation for local businesses works differently than broad marketing campaigns. Geographic proximity changes everything, from how people search to how fast they convert.
76% of smartphone users who search for something nearby visit a business within 24 hours.
This guide covers how to attract nearby customers through local SEO, Google Business Profile optimization, location-specific content, and targeted advertising. You’ll learn which methods drive the most qualified leads and which mistakes cost local businesses visibility every day.
What Is Local Lead Generation
Local lead generation is the process of attracting potential customers who are physically close to your business location and converting them into paying clients.
Unlike broad marketing campaigns that target anyone with internet access, this approach focuses on geographic targeting to reach people in your city, neighborhood, or service area.
The numbers back this up. 76% of people who search for something nearby on their smartphones visit a business within 24 hours.
That statistic alone explains why local customer acquisition matters so much for service-based businesses.
The goal is simple: get your business in front of people who can actually walk through your door or call you for service today.
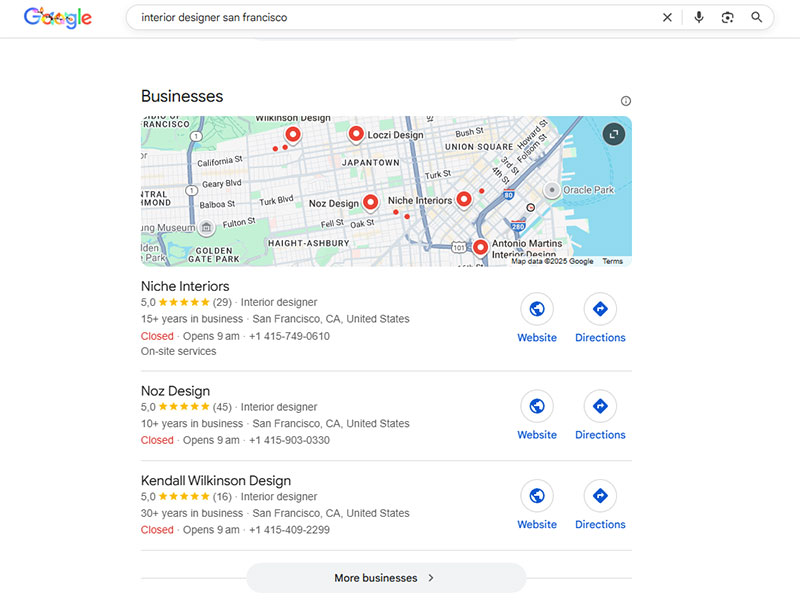
This includes showing up in Google Maps results, appearing in the local pack, and building visibility across local business directories.
Your potential customers are already searching. They type “plumber near me” or “best coffee shop downtown” into their phones.
Local lead generation puts your business at the top of those results.
How Local Lead Generation Differs from Traditional Lead Generation
Traditional lead generation casts a wide net. You might target anyone interested in your product category, regardless of where they live.
Local lead generation flips that approach entirely.
Proximity-based advertising targets customers within a specific radius of your business. A dental practice in Austin doesn’t need leads from Seattle.
Here’s how the two approaches compare:
| Factor | Traditional Lead Gen | Local Lead Gen |
| Audience | Broad, nationwide | Geographically defined |
| Conversion Speed | Longer sales cycle | Faster, often same-day |
| Competition | Global players | Nearby competitors |
| Intent | Variable | High (ready to act) |
Local customers convert faster because they have immediate needs.
Someone searching “emergency plumber” at 10 PM wants help now, not a newsletter subscription.
The local buyer journey is compressed. Search, find, call, hire. Sometimes all within an hour.
Service area businesses benefit most from this compressed timeline. Plumbers, HVAC technicians, electricians, home services, legal practices.
These industries thrive on hyperlocal marketing because their customers need proximity.
You can’t fix a broken pipe remotely.
What Types of Local Businesses Benefit from Lead Generation
Not every business needs local leads. An online course creator can sell worldwide.
But if customers need to physically interact with your business (or you need to reach them), local lead generation becomes your primary growth channel.
Research from SOCi shows 80% of U.S. consumers search for local businesses weekly, with 32% searching daily. According to Google, 76% of people who conduct a local search on their smartphone visit a business within 24 hours.
Service-Based Businesses
Home services dominate this category. Plumbing, HVAC, electrical, roofing, landscaping.
Lead generation for contractors depends almost entirely on geographic proximity. Data from Google reveals that 28% of local searches lead to a purchase, making proximity-based marketing critical for contractors.
Lead generation for law firms follows similar patterns since clients prefer attorneys who understand local courts and regulations. According to BrightLocal research, 72% of consumers visit shops within five miles of their location when performing a local search.
Lead generation for healthcare practices requires nearby patients who can attend appointments in person. Healthcare brands saw substantial increases in local search impressions in 2024, according to Rio SEO data.
Action step: Optimize your Google Business Profile with accurate service area information. Studies show businesses with complete profiles receive seven times more clicks than incomplete listings.
Retail and Hospitality
Restaurants live and die by foot traffic. A 5-star review from someone in another state means nothing if locals don’t know you exist.
According to WebFx, 90% of diners research restaurants online before making dining decisions. SemRush data shows 62% of consumers use Google search to look for a restaurant. Restaurant bookings from local search jumped 654% year-over-year in Q1 2024, according to Rio SEO.
Salons, spas, and boutique retailers depend on walk-in customers and repeat neighborhood visits. Data from Placer.ai shows retail foot traffic increased 6.8% in June 2024, its highest level in 12 months.
Hotels and event venues target travelers heading to specific destinations. Hotel clicks grew 8.1% quarterly and 12.4% year-over-year in Q2 2024, according to industry data.
Implementation:
- Upload menu items or service photos to your Google Business Profile (businesses using images see 17% higher revenue per visitor)
- Set up automated review requests within 24 hours of service completion
- Monitor foot traffic patterns using tools like Placer.ai or Google Maps insights
Professional Services
Lead generation for financial advisors works best locally because clients want face-to-face meetings for major money decisions.
According to Synup, 78% of local searches on mobile devices lead to offline purchases. This pattern applies to financial services where trust builds through in-person consultations.
Lead generation for real estate is inherently geographic. Agents serve specific markets and neighborhoods.
Research shows 60% of mobile users contact a business directly from search results by clicking to call or requesting directions. For real estate agents working in defined territories, this translates to immediate lead opportunities.
Lead generation for coaches and consultants can work remotely but often build stronger practices through local networking and referrals.
Track these benchmarks:
- Google Business Profile views (aim for 80-300 monthly clicks based on optimization level)
- Direction requests (indicates high intent to visit)
- Website clicks from local listings (56% of GBP engagement converts to site visits)
- Call volume from search results (60% of mobile users call directly)
Key insight: According to Keywords Everywhere, there are 5.9 million keywords related to “near me” with 800 million monthly searches. “Open now near me” searches increased 400%, showing consumers expect real-time availability.
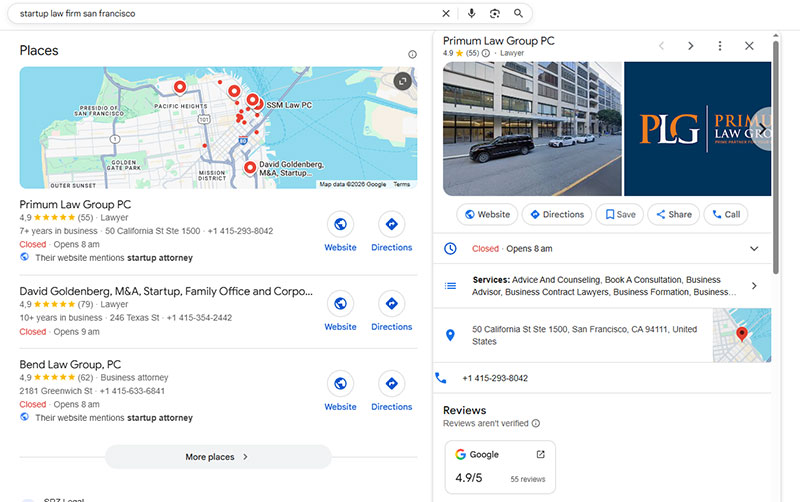
How Does Google Business Profile Improve Local Visibility
Google Business Profile (formerly Google My Business) is the single most important tool for local visibility.
It controls how your business appears in Google Search, Google Maps, and the local pack (those three business listings that show up for local queries).
When someone searches “dentist near me,” Google pulls results primarily from Business Profile data. According to Birdeye’s 2025 study, 86% of Google Business Profile views come from category-based searches like this.
Setting Up Your Profile Correctly
Claim your listing at business.google.com if you haven’t already.
Use your business email, not a personal Gmail address. This makes verification smoother and adds credibility.
Complete every section. Research from Birdeye shows that verified profiles with complete data are 80% more likely to appear in search results. Incomplete profiles get buried.
According to Google’s own data, businesses with complete profiles are 2.7x more likely to be considered reputable by customers and 50% more likely to drive purchases.
Implementation checklist:
- Business name (exactly as it appears offline)
- Accurate address with correct formatting
- Primary phone number
- Business hours (including special hours for holidays)
- Website URL
- Business category (primary and secondary)
- Business description (750 characters)
- Service areas (if applicable)
- Attributes (wheelchair accessible, outdoor seating, etc.)
NAP Consistency Matters
NAP stands for Name, Address, Phone number. These three details must match exactly across every platform.
Your website, Google Business Profile, Yelp, Facebook, and every directory listing should display identical information.
Research from the Local SEO Ranking Factors Survey confirms NAP consistency as a top-five ranking factor for both the Local Pack and organic search results.
Even small differences hurt you. “123 Main Street” versus “123 Main St.” can confuse search algorithms. According to industry data, inconsistent NAP information signals to Google that your business may not be legitimate or reliable.
Action steps:
- Audit all listings (use tools like Moz Local or BrightLocal)
- Standardize your address format to match USPS formatting
- Use the same phone number everywhere (preferably local, not toll-free)
- Create a reference document with your exact NAP format
- Update any inconsistencies within 48 hours
Categories and Descriptions
Choose your primary category carefully. Whitespark’s local SEO expert survey found that primary business category is the #1 local ranking factor according to industry professionals.
A pizza restaurant shouldn’t list “Italian Restaurant” as primary if most customers search for pizza specifically.
Add relevant secondary categories to expand keyword coverage without diluting your main focus.
Write a business description that explains what you do, who you serve, and what makes you different. Include your city and neighborhood naturally.
Data from Localo’s analysis of 2 million profiles shows that 75% of businesses ranking in positions 1-3 have completed descriptions, compared to under 40% for businesses ranking 11-20.
Businesses in top positions use approximately 70 words in their descriptions, while lower-ranking businesses use fewer than 50 words.
The Three Ranking Factors
Google’s local algorithm considers three things:
- Relevance (How well your profile matches the search query)
- Distance (How close you are to the searcher’s location)
- Prominence (How well-known and trusted your business is)
You can’t control distance. But relevance and prominence? Those improve with optimization.
Track these performance indicators:
- Monthly profile views (aim for 200+ based on Birdeye data)
- Search impressions (40% of businesses exceed 1,000 monthly)
- Customer actions (website visits, calls, direction requests)
- Photo views (15+ photos correlate with stronger engagement)
Reviews Drive Rankings
Review signals directly affect map pack ranking.
Quantity matters. Quality matters. Recency matters.
According to BrightLocal’s analysis of 93,000 local businesses, businesses ranking in positions 1-3 have an average of 47 Google reviews. Those in positions 7-10 average only 38 reviews.
SOCi research shows businesses ranking 1-3 have 21% more reviews than businesses ranked 4-10.
Star ratings matter too. Top-ranking businesses average 4.47 stars, and anything below 3 stars significantly reduces customer consideration. BrightLocal data reveals only 13% of consumers would engage with a business rated 1-2 stars.
Review generation system:
- Send review requests within 24 hours of service completion
- Include direct Google review link (get from your GBP dashboard)
- Send to satisfied customers only (track satisfaction scores)
- Follow up once after 3 days if no response
- Target 2-3 new reviews per month minimum
Response strategy:
Respond to every review within 24-48 hours. According to Localo’s research, businesses ranking 1-3 write responses averaging 140 words, while lower-ranking businesses average 100-120 words.
For positive reviews: Thank them, mention specific details they mentioned, invite them back.
For negative reviews: Apologize, take ownership, offer specific solution, move conversation offline.
Google rewards active engagement. According to industry research, responding to reviews can have a minor but measurable impact on rankings, plus it builds trust and improves conversion rates.
Benchmark goal: Reach 10 reviews first (rankings improve significantly at this threshold), then aim for 50+ reviews to compete in the top 3 positions. According to SOCi data, conversion rates increase by 2.8% for every 10 new reviews earned.
What Are the Best Methods to Generate Leads for Local Businesses
Multiple channels work together for local lead generation. Relying on just one is risky.
The businesses that dominate local search use a combination of organic optimization, paid advertising, and community presence.
According to Sopro research, multi-channel marketing campaigns achieve a 31% lower average cost per lead than single-channel outreach.
Local Search Optimization
Your website needs to rank for location-specific keywords.
“Plumber” is too broad. “Emergency plumber in Austin” targets people who can actually become customers.
Include your city, neighborhood, and service areas throughout your site. Page titles, headings, body text, meta descriptions.
Research from BrightEdge shows SEO drives 1000% more traffic than organic social media. According to data analysis, leads from organic search have a 14.6% close rate, demonstrating high-value creation versus other channels.
Mobile search optimization is non-negotiable. Most local searches happen on phones.
Data from Statista shows 61% of organic search engine visits come from mobile devices as of Q2 2024. According to a Think With Google study, 28% of mobile searches for something nearby result in a purchase.
Page speed affects rankings. Slow sites lose impatient searchers to faster competitors.
Research shows 46% of people will abandon a website that takes longer than 4 seconds to load on mobile. First-page Google results load in an average of 1.65 seconds. According to Google data, 53% of mobile site visitors leave a page if it takes more than 3 seconds to load.
Implementation checklist:
- Target load time: Under 3 seconds on mobile
- Use Google PageSpeed Insights for baseline audit
- Compress images (aim for under 100KB per image)
- Enable browser caching
- Minimize JavaScript and CSS files
- Use a Content Delivery Network (CDN)
Location Landing Pages
Create separate pages for each city or neighborhood you serve.
A roofing company covering five suburbs needs five dedicated pages, not one generic “Service Areas” list.
Each page should include:
- Unique content about that specific area (minimum 500 words)
- Local landmarks and neighborhood references
- Testimonials from customers in that location
- Embedded Google Map showing your proximity
- Service-specific details for that area
- Local phone number if available
Avoid duplicate content. Google penalizes pages that only swap out city names while keeping everything else identical.
Reference local details that prove you actually work there. Mention the park down the street, the popular intersection, the high school everyone knows.
Monthly tracking metrics:
- Organic traffic per location page
- Local keyword rankings (track top 5-10 keywords per page)
- Conversion rate by location
- Time on page (target 2+ minutes)
Online Review Management
Reviews build trust before customers ever contact you.
According to BrightLocal’s 2025 survey, 83% of consumers read Google reviews before making a decision. Research shows 93% of consumers say reviews influence their purchasing decisions.
Create profiles on Google Business Profile, Yelp, Facebook, and industry-specific directories like Angi or HomeAdvisor.
Ask for reviews at the right moment. Right after completing a successful job works best.
Data shows businesses with more reviews rank higher. Companies ranking positions 1-3 average 47 Google reviews, while those in positions 7-10 average only 38 reviews.
Review generation system:
- Send review request within 24 hours of service completion
- Use automated email/SMS with direct review link
- Follow up once after 3 days if no response
- Track which team members generate most reviews
- Target 2-3 new reviews per month minimum
Respond to negative reviews professionally. How you handle complaints tells potential customers more than the complaint itself.
According to industry data, 65% of consumers are more likely to choose a business that responds to reviews.
Geo-Targeted Advertising
Google Ads with radius targeting puts your business in front of people within a specific distance.
Facebook and Instagram ads let you target by zip code, city, or even specific neighborhoods.
According to Saleshandy data, 44% of B2B marketers choose LinkedIn as their top choice for generating leads, while Facebook accounts for 33%. For B2C businesses, 51% select Facebook as their top marketing choice.
Define your audience beyond just location. Age, interests, behaviors, homeowner status.
The tighter your targeting, the lower your cost per lead.
Campaign setup framework:
- Start with 5-10 mile radius around business location
- Set daily budget at $30-50 minimum for testing
- Create separate ad sets for different services
- Track cost per lead by service type
- Pause ads with CPL above $100 (adjust for your industry)
- Test 3-5 ad variations per campaign
Benchmark targets:
- Google Ads: $50-150 cost per lead for home services
- Facebook Ads: $25-75 cost per lead for local services
- Click-through rate: 2-5% minimum
Email Marketing with Local Context
Email still delivers one of the highest ROIs in marketing.
According to recent statistics, email marketing has an ROI of approximately 4400% (a $1 investment returns $42). Research shows 78% of businesses use email marketing for lead generation.
Personalize messages with local references. Mention upcoming weather, local news, neighborhood events.
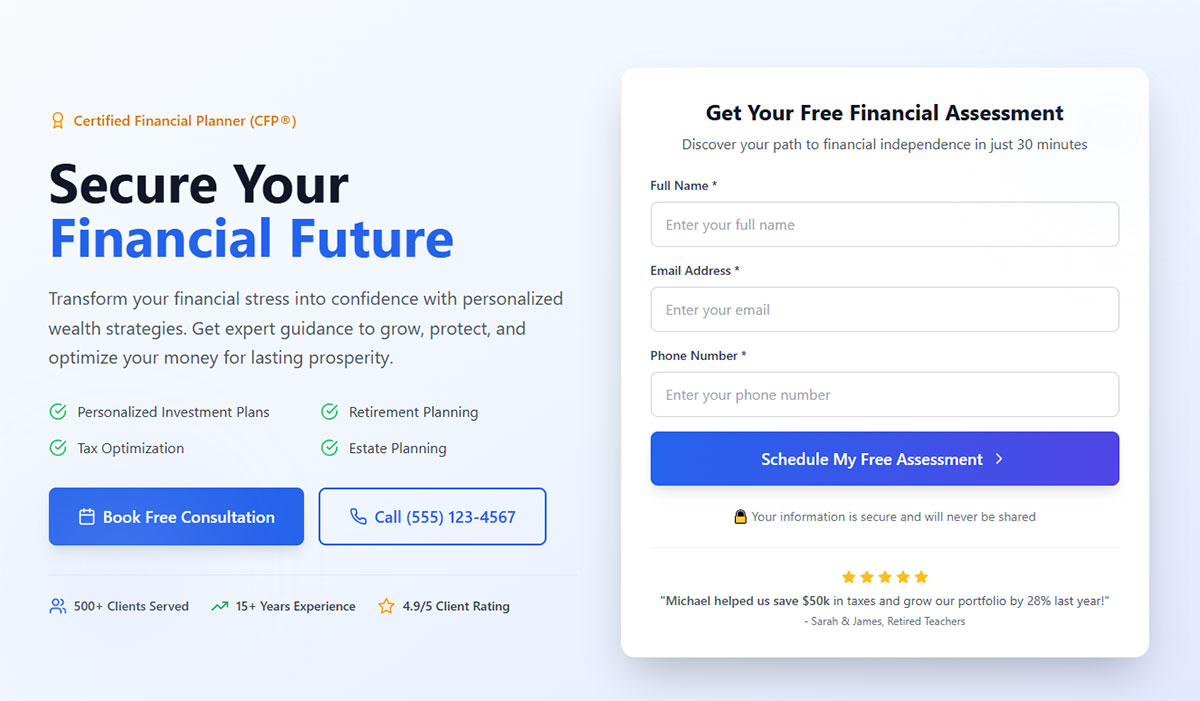
Build your list through lead capture forms that offer something valuable in exchange for contact information.
A lead magnet like a “Home Maintenance Checklist for [City] Homeowners” performs better than generic content.
Data shows segmented email campaigns drive 30% more opens and 50% higher click rates than non-targeted batches.
Segment your list by neighborhood or service type. Send relevant offers to the right people.
Email campaign structure:
Monthly newsletter:
- Local news or seasonal tips (40%)
- Service spotlight or case study (30%)
- Special offer for that area (30%)
Quarterly promotional campaign:
- Time-sensitive discount
- Neighborhood-specific offers
- Referral incentives
Performance benchmarks:
- Open rate: 20-25% minimum
- Click-through rate: 2-3% minimum
- Unsubscribe rate: Under 0.5%
- Send emails Monday-Thursday, 10am-2pm for best results
Lead nurture sequence (new subscribers):
- Day 1: Welcome email with local introduction
- Day 3: Educational content about your services
- Day 7: Customer testimonial from their area
- Day 14: Special first-time customer offer
- Day 30: Case study or project showcase
According to APSIS data, 53% of B2B marketers consider email the most effective channel for generating warm leads.
How Do You Create Effective Local Landing Pages
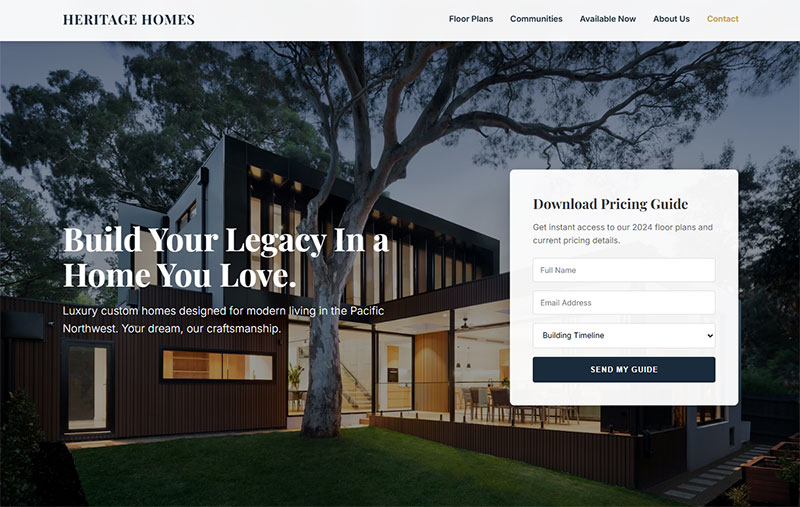
Local landing pages serve as dedicated entry points for customers in specific geographic areas.
Each page targets a single city, neighborhood, or service zone. One page per location, not a generic list.
According to Unbounce’s Q4 2024 analysis of 41,000 landing pages, the median landing page conversion rate is 6.6% across all industries. Research shows local landing pages with multiple location-based offers have a 185% higher conversion rate than generic pages.
Structure That Ranks
Your H1 heading must include both service and location. “Roof Repair in Brooklyn” beats “Our Roofing Services.”
Place your NAP (Name, Address, Phone) in the header or footer of every page. Consistency matters.
Embed a Google Map showing your business location or service area coverage.
Add LocalBusiness schema markup to help search engines understand your geographic relevance.
Despite clear benefits, only 12.4% of domains leverage structured data as of 2024, according to Schema.org. This limited adoption represents a significant competitive advantage for businesses that implement it properly.
Schema implementation checklist:
- Use JSON-LD format (preferred by Google)
- Include business type (use specific subtype, not generic “LocalBusiness”)
- Add opening hours with day-by-day schedule
- Include geo coordinates (latitude and longitude)
- Add price range if applicable
- Include accepted payment methods
- Add service areas with specific coverage zones
- Test with Google’s Rich Results Test tool
According to Nifty’s analysis of top-ranking local pages, 55% include the business name in the title tag, which boosts credibility and trust.
Content That Converts
Write unique descriptions for each location. Swapping city names while keeping identical text triggers duplicate content penalties.
Research shows local landing pages with images and graphics get 94% more views than text-only pages. According to industry data, landing pages with copy at 5th-7th grade reading level achieve an 11.1% conversion rate versus 5.3% for college-level copy.
Reference hyperlocal details:
- Neighborhood names and nicknames locals actually use
- Popular intersections and landmarks
- Nearby schools, parks, or well-known businesses
- Parking information and directions
- Local events or community involvement
Include case studies or project photos from that specific area. A roofing job in Williamsburg means more to Williamsburg residents than generic stock photos.
Nifty’s research found that 36% of top local landing pages feature customer testimonials, while 30% include videos. According to multiple studies, video on landing pages can boost conversion rates by 80-86%.
Content requirements:
- Minimum 500-900 words (Nifty data shows top pages average 935 words)
- 3-5 customer testimonials from that location
- 5-10 high-quality images showing local work
- Location-specific service details
- Local phone number prominently displayed
- Emergency service availability (if applicable)
Calls-to-Action That Work
Use local phone numbers instead of toll-free lines. Local area codes build trust.
Add click-to-call buttons for mobile visitors. Data shows 82.9% of landing page traffic comes from mobile devices, making mobile optimization critical.
Your contact form should be visible without scrolling. Keep form fields minimal to improve form abandonment rates.
Research proves landing pages with 5 or fewer form fields convert 120% better than pages with lengthy forms. According to HubSpot data, most marketers use 5 fields in forms, but reducing even one field can increase conversions by up to 50%.
Optimal form structure:
- Name (full name, not first/last separately)
- Phone number
- Email address
- Service needed (dropdown)
- Preferred contact method
Include your hours of operation prominently. Update them for holidays.
CTA placement strategy:
- Primary CTA above the fold (visible without scrolling)
- Secondary CTA after testimonials section
- Final CTA at bottom of page
- Sticky mobile CTA button (follows scroll)
According to Unbounce research, landing pages with a single call-to-action have a 13.5% average conversion rate. Data shows personalized CTAs have 202% better performance than generic ones.
Performance tracking metrics:
- Conversion rate (target 6.6% minimum based on industry median)
- Time on page (target 2+ minutes)
- Bounce rate (target under 60%)
- Form submission rate (target 4-5%)
- Mobile vs. desktop performance
- Click-to-call rate (mobile)
- Map interaction rate
Page speed requirements:
According to research, landing pages that load in under 2 seconds have a 30% higher conversion rate. Data shows 53% of mobile users abandon pages taking over 3 seconds to load.
Speed optimization checklist:
- Target load time: Under 2 seconds
- Compress all images to under 100KB
- Use lazy loading for below-fold images
- Minimize JavaScript execution
- Enable browser caching
- Use CDN for faster delivery
- Test with Google PageSpeed Insights monthly
Research from Portent shows pages loading in 1 second have a 31.79% conversion rate, while pages taking 5 seconds drop to 3.3%.
Testing and optimization:
According to industry data, 48% of marketers create a new landing page for each campaign. Research shows businesses with 40+ landing pages generate 12x more leads than those with 5 or fewer.
Monthly optimization tasks:
- A/B test headlines (run for minimum 2 weeks)
- Test CTA button color and copy
- Adjust form field requirements
- Update testimonials quarterly
- Refresh images every 6 months
- Monitor heatmaps for user behavior
- Update schema markup when business details change
What Role Does Content Play in Attracting Nearby Customers
Content builds community trust and signals geographic relevance to search engines.
Generic blog posts don’t help local SEO. Location-specific content does.
According to Content Marketing Institute, 87% of marketers report that content marketing generates demand and leads (up 11 points since 2023). Research shows 74% of marketers say content marketing helps nurture audiences and customers.
Location-Specific Blog Posts
Write about topics that matter to your local audience.
A landscaping company in Phoenix should cover drought-resistant plants, not New England gardening tips.
Cover local events you sponsor or attend. Reference seasonal issues specific to your region.
Address neighborhood-specific problems. “Common Basement Flooding Issues in Hoboken” targets exactly the right audience.
According to research, companies that blog generate 67% more leads than those that don’t. Data shows businesses with blogs see 55% more website visitors than those without.
Content strategy framework:
Monthly content calendar:
- 2 location-specific service posts (500-900 words each)
- 1 local event or community involvement post
- 1 seasonal maintenance/preparation guide for your area
- 1 neighborhood spotlight or local problem-solving post
Topic selection process:
- Monitor local Facebook groups for common questions
- Track seasonal issues specific to your climate
- Research local keyword volume (use Google Keyword Planner)
- Survey customers about their most pressing concerns
- Track which blog posts drive most conversions
According to industry data, 83% of marketers say it’s better to focus on quality rather than quantity of content, even if it means posting less often.
Performance metrics to track:
- Organic traffic by blog post
- Local keyword rankings (track top 10 per post)
- Time on page (target 2+ minutes)
- Social shares from local audience
- Lead generation by content piece
- Conversion rate from blog visitors
Local Customer Testimonials
Testimonials from named customers in specific areas carry more weight than anonymous reviews.
Ask permission to include customer names, neighborhoods, and photos of completed work.
Research shows 72% of customers trust a brand more with positive video testimonials. According to BrightLocal data, 92% of customers trust a personal recommendation from friends or family.
Video testimonials perform better than text. A 30-second clip of a satisfied customer at their home builds instant credibility.
Studies prove video testimonials can increase conversion rates by 80%. According to research, 79% of consumers are more likely to buy after watching a video testimonial. Data shows businesses using video testimonials have 49% more sales than those without.
Feature testimonials on location pages, not just a generic reviews section buried in your footer.
Testimonial collection system:
Request timing:
- Within 24-48 hours of job completion
- When customer expresses satisfaction during final walkthrough
- After positive follow-up communication
- During seasonal check-ins with past customers
Video testimonial script (30-60 seconds):
- What problem were you facing? (10 seconds)
- Why did you choose our company? (10 seconds)
- What was your experience like? (20 seconds)
- Would you recommend us? (10 seconds)
According to industry data, 90% of people trust customer testimonials more than what the company says about itself. Research shows 88% of marketing teams see at least a 10% lift in conversions when incorporating testimonial videos.
Testimonial deployment strategy:
- Homepage: 3-5 rotating video testimonials
- Service pages: 2-3 relevant testimonials per service
- Location pages: 3-5 testimonials from that specific area
- Checkout/contact page: 1 highly relevant testimonial
- Email campaigns: Include 1 testimonial per email
Studies show including video testimonials in emails increases click-through rates by 200-300%.
Community Partnership Content
Sponsor local sports teams, charity events, or community programs.
Create content around these partnerships. Blog posts, photos, event recaps.
Collaborate with complementary local businesses. A wedding photographer can partner with florists, venues, and caterers for cross-promotion.
This builds local backlinks naturally while establishing your business as part of the neighborhood.
According to research, 73% of B2B marketers consider content marketing (particularly blogs and whitepapers) the most effective strategy for boosting leads and sales.
Partnership content framework:
Pre-event content:
- Announcement blog post (300-500 words)
- Social media countdown (5-7 days before)
- Email to customer list announcing sponsorship
- Local media outreach (press release)
During-event content:
- Live social media updates (Instagram Stories, Facebook Live)
- Behind-the-scenes photos and videos
- Team member participation photos
- Customer/community interaction captures
Post-event content:
- Recap blog post with photos (700-1000 words)
- Thank you social posts tagging partners
- Video highlight reel (1-2 minutes)
- Results/impact summary (funds raised, attendance)
- Tag all partner businesses and participants
Content distribution checklist:
- Publish on company blog
- Share across all social channels
- Email to customer database
- Post in relevant local Facebook groups
- Tag partner businesses for amplification
- Submit to local news outlets
- Add to Google Business Profile posts
According to Siege Media research, 62.8% of content marketers see traffic growth between 2024 and 2025. Data shows 51% of small businesses plan to invest more in content marketing in 2025.
Local backlink acquisition strategy:
Target these local link sources:
- Local chamber of commerce directory
- City business association listings
- Local news sites (through press releases and stories)
- Neighborhood blogs and community sites
- Partner business websites
- Local event calendars
- Industry-specific local directories
- Local university resources pages
- Municipal government resource pages
According to Backlinko research, the #1 result in Google has an average of 3.8 times more backlinks than positions 2-10.
Monthly partnership goals:
- Participate in 1-2 community events
- Create 2-3 pieces of partnership content
- Generate 2-4 new local backlinks
- Cross-promote with 1-2 complementary businesses
- Get mentioned in local news/blogs once per quarter
Research shows organic search accounts for 52.7% of B2B revenue share, surpassing average industry standards. According to data, 70% of B2B marketers believe SEO is more effective than PPC in driving sales.
How Do You Measure Local Lead Generation Success
Tracking the right metrics tells you what’s working and what’s wasting money.
Gut feelings don’t scale. Data does.
According to Gartner’s 2025 Tech Marketing Benchmarks Survey, “proving ROI with analytics” is a top-three challenge for marketers. Research shows only 36% of marketers say they can accurately measure ROI, while 47% struggle to measure it across multiple channels.
Key Performance Indicators
Monitor these numbers monthly:
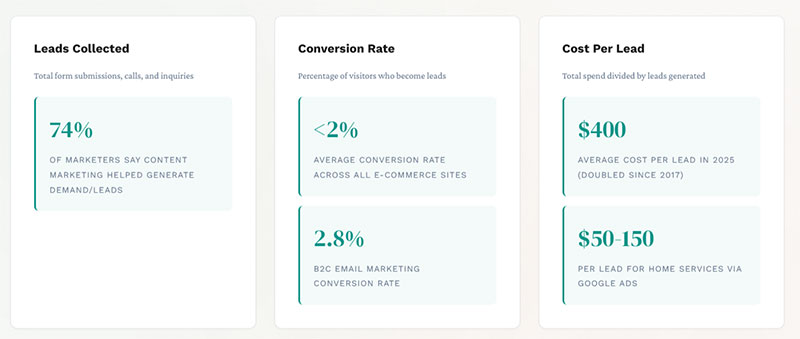
Leads collected (Total form submissions, calls, and inquiries)
Research from HubSpot shows lead generation is the 3rd most important metric when measuring content marketing effectiveness. According to industry data, 74% of marketers say content marketing helped generate demand/leads.
Conversion rate (Percentage of visitors who become leads)
Data shows the average conversion rate across all e-commerce sites is under 2%. For B2C brands, email marketing achieves a 2.8% conversion rate, while B2B sees 2.4%.
Cost per lead (Total spend divided by leads generated)
According to recent statistics, the average cost per lead has doubled since 2017, from approximately $200 to around $400 across industries. For home services via Google Ads, expect $50-150 per lead.
Lead-to-customer rate (Percentage of leads that become paying customers)
Industry research shows only 21% of leads generated are sales-ready and converted. According to B2B data, 27% of leads are sales-ready when generated.
Customer acquisition cost (Full cost to gain one new customer)
Calculate total marketing spend (ads, tools, salaries, overhead) divided by new customers acquired. Benchmark against customer lifetime value (aim for 3:1 ratio minimum).
Break down every metric by source. Google organic, Google Ads, Facebook, referrals, direct.
Monthly tracking spreadsheet columns:
- Traffic source
- Visitors
- Leads generated
- Conversion rate (%)
- Cost per lead ($)
- Leads to customers
- Customer conversion rate (%)
- Total revenue generated
- ROI (%)
According to HubSpot research, marketers who compute their ROI are 1.6 times more likely to be awarded higher budgets for their marketing activities.
Google Business Profile Insights
Your Business Profile dashboard shows:
- How many people found you through search vs. maps
- Which queries triggered your listing
- Customer actions (calls, direction requests, website clicks)
- Photo views compared to competitors
Check these weekly. Drops in visibility indicate problems. Spikes reveal opportunities.
According to Birdeye’s 2025 research, the average Google Business Profile drives around 200 clicks per month. Data shows 48% of interactions are website visits, 34% are direction requests, and 17% are phone calls.
Weekly GBP monitoring checklist:
- Total views (search + maps)
- Customer actions by type
- Search queries driving impressions
- Photo engagement vs. competitors
- New reviews (quantity and rating)
- Response time to reviews
- Posts engagement rate
Research shows businesses with complete, verified Google Business Profiles get 4x more website visits, 12% more calls, and 10% more direction requests than incomplete profiles.
Website Analytics
Google Analytics tracks which location pages drive traffic and conversions.
Google Search Console shows which local keywords you rank for and which pages appear in search results.
Set up goal tracking for lead generation form submissions and phone calls.
Use call tracking software to attribute phone leads to specific campaigns or pages.
According to industry data, businesses with blogs see 55% more website visitors than those without. Research shows companies that blog are 13 times more likely to get a positive ROI.
Google Analytics 4 essential reports:
Acquisition overview:
- Traffic by source/medium
- New users by channel
- Conversion rate by traffic source
- Cost per acquisition by channel
Engagement reports:
- Top landing pages by traffic
- Pages by conversion rate
- Average engagement time
- Bounce rate by page type
Conversion tracking:
- Form submissions by page
- Phone call clicks
- Direction request clicks
- Appointment bookings
Monthly analytics review process:
- Export all traffic sources with conversions
- Calculate conversion rate per source
- Compare cost per lead across paid channels
- Identify best-performing location pages
- Find high-traffic, low-conversion pages needing optimization
- Track month-over-month growth trends
- Update budget allocation based on ROI
According to research, data-driven companies report 5-8% higher marketing ROI than their competitors.
ROI by Service Area
Calculate profitability per neighborhood or city you serve.
Some areas generate high volume but low-value customers. Others produce fewer leads that convert into premium jobs.
Shift your budget toward locations with the best return, not just the most leads.
According to marketing statistics, successful advertising campaigns achieve a median profit-based ROI of $2.43 (meaning $2.43 profit for every $1 spent).
Service area profitability analysis:
For each location, track:
- Total marketing spend (ads, content, time)
- Number of leads generated
- Cost per lead
- Lead-to-customer conversion rate
- Average job value
- Total revenue generated
- Profit margin after costs
- ROI percentage
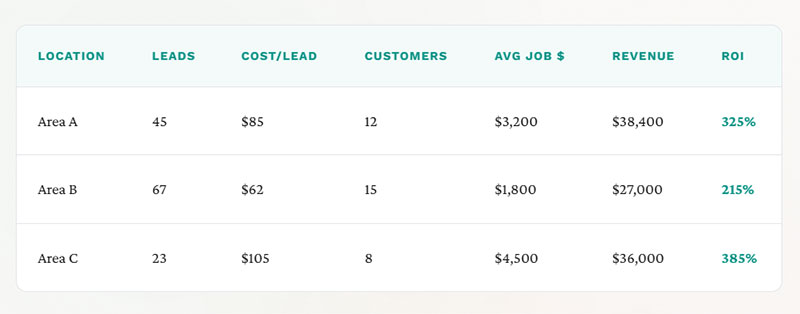
Quarterly analysis template:
| Location | Leads | Cost/Lead | Customers | Avg Job $ | Revenue | ROI |
|---|---|---|---|---|---|---|
| Area A | 45 | $85 | 12 | $3,200 | $38,400 | 325% |
| Area B | 67 | $62 | 15 | $1,800 | $27,000 | 215% |
| Area C | 23 | $105 | 8 | $4,500 | $36,000 | 385% |
This reveals Area C produces fewer leads but highest ROI through premium pricing and better conversion.
Budget reallocation strategy:
- Rank all service areas by ROI
- Identify top 3 performers
- Increase budget 20-30% to top performers
- Maintain or reduce spend on bottom performers
- Test new areas with 10% of total budget
- Re-evaluate quarterly
According to research, 64% of companies base future marketing budgets on past ROI performance, highlighting the critical role of area-specific tracking.
Channel-specific ROI benchmarks:
Email marketing: $40-42 ROI for every $1 spent (one of highest returns) SEO: $22.24 for every dollar spent (long-term compound growth) Google Ads: $2 in revenue for every $1 spent (depends on optimization) Content marketing: 3x more leads than traditional marketing at 62% less cost Social media: ROI varies significantly (50% of marketers struggle to measure)
According to HubSpot data, 83% of marketing leaders now consider demonstrating ROI as their top priority, up from 68% five years ago.
Red flags requiring immediate action:
- Cost per lead exceeds industry average by 50%+
- Lead-to-customer rate below 10%
- Month-over-month traffic decline exceeding 20%
- Google Business Profile views dropping 30%+
- Paid ad spend increasing while conversions decline
- Location pages losing ranking positions
Success indicators:
- Cost per lead trending downward month-over-month
- Lead-to-customer rate above 20%
- ROI exceeding 200% across all channels
- Organic traffic growing 10%+ monthly
- Multiple location pages ranking top 3 for target keywords
- Google Business Profile actions increasing consistently
What Tools Help with Local Lead Generation
The right tools save time and improve results. The wrong ones add complexity without value.
Start simple. Add tools as you scale.
According to research, the local SEO software market was valued at $16.67 billion in 2023 and is projected to reach $59.76 billion by 2030, growing at a 20% CAGR. Data shows 91% of organizations report that SEO has positively affected both website performance and overall marketing goals.
Free Essential Tools
Google Business Profile – Manage your listing, post updates, respond to reviews
According to BrightLocal, 76% of marketers consider Google Business Profile management the most valuable local SEO service. Research shows businesses with complete profiles get up to 7x more clicks.
Google Analytics – Track website traffic and conversions
Data shows organic traffic accounts for 53% of all trackable traffic to websites, making analytics essential for understanding where leads come from.
Google Search Console – Monitor search performance and fix indexing issues
Research reveals this tool helps identify which local keywords you rank for and which pages need optimization.
Bing Places – Claim your listing on Microsoft’s search engine
Bing is the second-most-popular search engine with nearly 4% of all searches monthly.
Apple Business Connect – Control how your business appears on Apple Maps
Among Apple users, 58.6% still prefer Google Maps, but 12% use Apple Maps exclusively, representing an audience you can’t ignore.
Free tools setup timeline:
- Week 1: Claim all business listings (Google, Bing, Apple)
- Week 2: Set up Google Analytics and Search Console
- Week 3: Complete all profile information
- Week 4: Add initial photos and posts
Paid Tools Worth Considering
BrightLocal and Whitespark help manage citations, track rankings, and monitor reviews across platforms.
According to market research, BrightLocal holds 19% market share and is used by over 12,000 agencies globally for reporting, review monitoring, and citation tracking.
Semrush and Ahrefs provide local keyword research and competitor analysis.
Industry data shows Ahrefs has 404 billion web pages in its index, making it powerful for backlink analysis. Research indicates businesses spend an average of $500 to $7,500 per month on SEO tools and services.
Moz Local automates directory submissions and keeps NAP data consistent.
According to industry experts, citation management and cleanup is considered valuable by 43% of marketers.
Paid tool selection criteria:
- Monthly budget available ($100-500+ range)
- Number of locations to manage
- Team size and expertise level
- Specific pain points (citations, rankings, reviews)
- Integration needs with existing systems
ROI evaluation process:
Month 1-3: Track baseline metrics without tool
- Leads generated
- Time spent on manual tasks
- Rankings for target keywords
- Citation accuracy across directories
Month 4-6: Implement tool and measure changes
- Lead volume increase
- Time saved per week
- Ranking improvements
- Citation correction rate
Calculate ROI: (Additional revenue – tool cost) / tool cost x 100
According to research, 71% of small businesses investing in SEO are satisfied with their results.
Lead Management
A CRM system like HubSpot or a simple spreadsheet tracks leads from first contact through conversion.
Research shows proper lead management can increase qualified leads by up to 451% when using marketing automation.
Use WordPress lead generation plugins to capture and organize inquiries from your website.
Email marketing platforms like Mailchimp nurture leads who aren’t ready to buy immediately.
According to industry data, email marketing generates an average ROI of $40-42 for every $1 spent, making it one of the highest-return channels.
Consider using multi-step forms to qualify leads and collect more information without overwhelming visitors upfront.
Data shows landing pages with 5 or fewer form fields convert 120% better than pages with lengthy forms.
Essential CRM features checklist:
- Contact management with tags/categories
- Lead source tracking
- Follow-up reminders and task management
- Email integration
- Conversion tracking
- Reporting dashboard
- Mobile app access
Lead nurture automation workflow:
Day 1: Welcome email with company introduction Day 3: Educational content about your services Day 7: Customer testimonial from their area Day 14: Special offer or consultation invitation Day 30: Case study relevant to their needs Day 45: Final check-in with direct call-to-action
According to research, businesses that nurture leads see a 451% increase in qualified leads.
Tool stack recommendations by business size:
Solo operator ($0-100/month):
- Free: Google Business Profile, Analytics, Search Console
- Paid: Mailchimp basic plan for email ($13/month)
- Total: Under $100/month
Small business 2-5 employees ($100-500/month):
- Free tools listed above
- BrightLocal or Whitespark ($50-100/month)
- HubSpot CRM (free) or paid CRM ($50/month)
- Email platform ($20-50/month)
- Total: $120-200/month
Growing business 5-20 employees ($500-2000/month):
- All above tools
- Semrush or Ahrefs ($100-400/month)
- Advanced CRM with automation ($200-500/month)
- Call tracking software ($50-150/month)
- Review management platform ($50-200/month)
- Total: $500-1,500/month
Critical tool integrations:
Google Business Profile + Google Analytics: Track which GBP actions lead to website conversions
CRM + Email platform: Automate follow-up based on lead behavior
Website forms + CRM: Automatically create contacts from submissions
Call tracking + CRM: Log phone leads with source attribution
Review platform + Google Business Profile: Monitor and respond to reviews from one dashboard
According to market data, 92% of local SEO professionals have experimented with ChatGPT for content creation and strategy, showing AI tools are becoming standard.
Monthly tool audit questions:
- Are we using all features we’re paying for?
- Has lead volume increased since implementation?
- Is time saved worth the monthly cost?
- Are team members actually using the tool?
- Could a cheaper alternative provide same value?
- What’s our actual ROI on this subscription?
Research shows 48% of local businesses say SEO is their top lead generation channel, making the right tools essential for staying competitive.
What Mistakes Reduce Local Lead Generation Results
Avoid these common errors. Each one costs you leads and money.
NAP Inconsistencies
Your business name, address, and phone number must match exactly everywhere online.
“Main Street” on Google and “Main St.” on Yelp confuses search algorithms. Fix every variation.
According to BrightLocal research, NAP consistency is confirmed as a top-five ranking factor for both the Local Pack and organic search results. Industry data shows 7% of consumers would abandon their search if they found incorrect address details.
Audit your citations quarterly using tools like BrightLocal or manual searches.
Citation audit process:
- Google your business name + city
- Check top 20 directory results
- Document NAP variations found
- Prioritize high-authority sites first (Google, Yelp, Facebook)
- Submit corrections to each platform
- Verify changes within 30 days
- Re-audit in 3 months
Research shows businesses with accurate listings are twice as likely to be considered reputable by consumers.
Duplicate Listings
Multiple Google Business Profiles for the same location compete against each other.
According to industry data, 23% of consumers encounter fake business listings at least once a month. Research reveals 56% of retailers haven’t even claimed their Google Business Profile, leaving room for duplicate entries.
Claim and merge duplicates. Remove fake or outdated listings created by users or previous owners.
Duplicate removal steps:
- Search Google Maps for your business name
- Look for multiple pins at same or similar addresses
- Claim ownership of all legitimate listings
- Request removal of duplicates through Google Business Profile dashboard
- Flag fake listings created by others
- Monitor weekly until resolved
- Set up Google Alerts for your business name
Data shows that having multiple profiles at the same address is one of the most impactful negative ranking factors according to local SEO experts.
Ignoring Reviews
Unanswered reviews signal that you don’t care about customer feedback.
According to BrightLocal’s 2025 survey, 83% of consumers read Google reviews before making a decision. Research shows 65% of consumers are more likely to choose a business that responds to reviews.
Respond to every review within 48 hours. Thank positive reviewers. Address complaints professionally.
Never argue with unhappy customers publicly. Offer to resolve issues offline.
Review response framework:
Positive reviews (under 50 words):
- Thank the customer by name
- Mention specific service they referenced
- Invite them back
- Include one relevant keyword naturally
Negative reviews (75-150 words):
- Apologize for their experience
- Acknowledge the specific issue
- Explain what you’ll do differently
- Offer to discuss offline (provide contact)
- Thank them for the feedback
According to research, 63% of consumers would lose trust in a business if they saw mostly negative written reviews, making professional responses critical.
Response time benchmarks:
Ideal: Within 24 hours Acceptable: Within 48 hours Poor: 3-7 days Damaging: Never
Industry data shows businesses that respond to at least 32% of their reviews see an 80% higher conversion rate compared to those that reply to just 10%.
Thin Location Pages
Pages with only an address and phone number provide no value. Google won’t rank them.
According to Nifty’s analysis, top-ranking local landing pages average 935 words of unique content. Research shows only 11% use keywords in the H1 heading, representing a missed opportunity.
Each location page needs 300+ words of unique, helpful content specific to that area.
Minimum content requirements:
- Service description tailored to that area (150-200 words)
- Local landmarks and neighborhood references (50-75 words)
- 2-3 customer testimonials from that location (75-100 words)
- Directions and parking information (25-50 words)
- Unique photos showing local work (minimum 5 images)
- Embedded Google Map
- LocalBusiness schema markup
According to research, local landing pages with images and graphics get 94% more views than text-only pages.
Content uniqueness test:
- Write content for Location A
- For Location B, don’t just swap city names
- Reference different landmarks, events, or local issues
- Use different customer testimonials
- Show different project photos
- Adjust service emphasis based on area demographics
Data shows Google penalizes pages with duplicate content, making unique location pages essential.
Poor Mobile Experience
Over 60% of local searches happen on phones.
According to Statista, 61% of organic search engine visits come from mobile devices. Research shows 53% of mobile users abandon pages taking over 3 seconds to load.
Test your site on multiple devices. Slow load times, tiny buttons, and hard-to-read text kill conversions.
Ensure your contact us page works flawlessly on mobile with easy tap-to-call functionality.
Mobile optimization checklist:
Page speed:
- Target: Under 3 seconds
- Compress all images under 100KB
- Enable browser caching
- Minimize CSS and JavaScript
- Test with Google PageSpeed Insights
Usability:
- Minimum 16px font size for body text
- Buttons at least 44×44 pixels (Apple guideline)
- Adequate spacing between clickable elements
- Click-to-call phone numbers
- Simple navigation (hamburger menu acceptable)
- Forms with large input fields
Functionality:
- Contact forms work on all devices
- Maps load properly and are interactive
- Images scale correctly
- No horizontal scrolling required
- All CTAs visible without zooming
According to research, 76% of people who conduct a local search on their smartphone visit a business within 24 hours, making mobile optimization critical for conversion.
Additional common mistakes:
Neglecting Google Business Profile posts:
- Post at least weekly
- Share updates, offers, events
- Use photos in every post
- Include clear calls-to-action
According to industry data, 48% of marketers create a new landing page for each campaign, showing the importance of dedicated, optimized pages.
Inconsistent business hours:
- Update for holidays immediately
- Mark special hours accurately
- Sync across all platforms
- Test “call” buttons during closed hours
Research shows 40% of consumers search specifically to check opening hours, making accuracy essential.
Using stock photos instead of real images:
- Authentic photos build trust
- Show actual team members
- Display real completed projects
- Feature your actual location
Data reveals profiles with real photos get 42% more direction requests on Google Maps.
Monthly mistake prevention audit:
Week 1: Check NAP consistency across top 10 directories Week 2: Review and respond to all new reviews Week 3: Test mobile site speed and usability Week 4: Update location page content and images
According to research, only 38% of small businesses have a structured review management strategy, leaving significant room for competitive advantage through systematic approaches.
How Do Local Businesses Build Trust with Nearby Customers
Trust determines who gets the call when customers compare options.
Price matters less than confidence. People pay more for businesses they believe will do the job right.
According to research, 92% of customers trust a personal recommendation from friends or family. Data shows 88% of consumers trust online reviews as much as personal recommendations.
Display Credentials Prominently
List licenses, certifications, insurance, and professional associations.
Show Better Business Bureau accreditation, Chamber of Commerce membership, and industry-specific credentials.
Include badges and logos on your homepage, service pages, and contact page.
According to industry data, customers are 2.7x more likely to consider a business reputable if it has a complete Google Business Profile with verified credentials.
Credential display strategy:
Homepage placement:
- Above the fold section with 3-5 key badges
- Trust bar with logos (certifications, associations)
- Years in business prominently displayed
- Insurance and licensing information
Service pages:
- Relevant certifications for that specific service
- Industry-specific credentials
- Safety compliance badges
- Quality assurance certifications
Footer (every page):
- License numbers where legally required
- Professional association memberships
- Industry awards or recognitions
- Better Business Bureau rating with link
Research shows 93% of consumers say reviews influence their purchasing decisions, making third-party verification critical.
Show Real People
Add team photos with names and roles. Stock photos of fake employees damage credibility.
Include brief bios highlighting experience and community connections.
Video introductions from owners or lead technicians personalize your business.
According to data, people remember 95% of a video message versus only 10% of written text. Research shows 64% of consumers are more likely to buy after watching a video testimonial.
Team profile elements:
Each team member should include:
- Professional headshot (not stock photo)
- Full name and title
- Years with company
- Relevant certifications
- Local connection (neighborhood resident, local school grad)
- Personal touch (hobby, favorite local spot)
- 50-75 word bio
Video introduction structure (60-90 seconds):
- Name and role
- How long with company
- Why they enjoy the work
- Commitment to customer satisfaction
- Personal connection to the community
Industry data shows authentic photos increase trust significantly compared to generic stock images.
Guarantee Your Work
Offer written guarantees or warranties. Explain exactly what’s covered.
Money-back guarantees or free re-service promises reduce perceived risk.
Display satisfaction rates if you track them. “98% customer satisfaction” builds confidence.
According to research, 72% of customers trust a brand more with positive testimonials and guarantees. Data shows clear guarantees can increase conversion rates by 25-30%.
Guarantee framework:
What to guarantee:
- Workmanship quality (30-90 days minimum)
- Materials used (1-5 years typical)
- Response time for service issues
- Satisfaction with final result
- On-time arrival (with compensation if late)
How to display:
- Dedicated guarantee page with full details
- Summary on homepage
- Mention in service descriptions
- Include in estimates and invoices
- Reference in follow-up emails
Trust-building language:
- “100% Satisfaction Guaranteed”
- “We’ll Make It Right or Refund Your Money”
- “Lifetime Warranty on Workmanship”
- “Risk-Free 30-Day Trial”
According to industry benchmarks, businesses offering strong guarantees see higher close rates despite premium pricing.
Respond Quickly
Speed matters for local leads. The first business to respond often wins the job.
Use WordPress contact form plugins that send instant notifications to your phone.
Set up auto-replies confirming you received inquiries and will respond shortly.
Track response times. Aim for under 5 minutes during business hours.
According to research, answering in under 5 minutes can elevate conversion rates by 9 times. Industry data shows 78% of customers choose the business that responds first.
Response time benchmarks:
Excellent: Under 5 minutes Good: 5-30 minutes Acceptable: 30-60 minutes Poor: 1-4 hours Unacceptable: 4+ hours or next day
Implementation system:
- Enable mobile notifications for form submissions
- Use SMS alerts for urgent inquiries
- Set up email-to-text forwarding
- Create response templates for common questions
- Assign backup responder when primary is unavailable
- Log all response times in CRM
- Review weekly to identify delays
Auto-response template: “Thanks for contacting [Business Name]! We received your message and will respond within [timeframe]. For urgent matters, call us at [phone number].”
According to data, 60% of mobile users contact a business directly from search results, making immediate response capability essential.
After-hours strategy:
Option 1: Auto-responder with next-day promise “Thank you for your inquiry. Our office hours are [hours]. We’ll respond first thing [tomorrow/Monday morning] by [time].”
Option 2: Emergency contact for urgent needs “For emergency service, call [emergency number]. For non-urgent inquiries, we’ll respond within one business day.”
Option 3: 24/7 answering service “Your call is important to us. Please hold while we connect you to our after-hours team.”
Research shows businesses with extended availability capture leads competitors miss.
Be Transparent About Pricing
Hidden fees destroy trust. List prices or price ranges where possible.
Offer free estimates. Explain your pricing structure clearly.
If competitors undercut you significantly, explain why your service costs more. Better materials, longer warranties, more experienced technicians.
According to industry data, 70% of consumers research prices online before contacting businesses. Research shows price transparency can increase inquiry rates by 35-40%.
Pricing transparency levels:
Level 1: Price ranges by service type “Standard furnace installation: $3,500-$5,500” “Kitchen remodel: $15,000-$45,000”
Level 2: Starting prices with variables “Roof replacement starting at $8,500” “Final price depends on: square footage, materials, complexity”
Level 3: Full pricing calculators Interactive tool where customers input specifics Instant estimate range provided Disclaimer that final quote may vary
Level 4: Exact pricing online “Standard service call: $89” “Additional labor: $125/hour”
Pricing page structure:
Introduction explaining your approach:
- Why quality matters over lowest price
- What’s included in your pricing
- How you determine final costs
Service-specific sections:
- Typical price ranges
- What affects final price
- What’s included vs. extra
- Financing options available
Value justification:
- Licensed and insured
- Experienced technicians
- Quality materials used
- Warranty/guarantee offered
- Years in business
Call-to-action:
- Request free estimate
- Schedule consultation
- Call for exact quote
According to research, 50% of consumers are willing to pay more for transparent pricing, even if it’s higher than competitors.
Competitive pricing response:
When competitors are cheaper, address it directly:
“We know you have choices. Here’s why customers choose us despite higher prices:”
- 15+ years experience vs. 2-3 years
- Lifetime warranty vs. 90 days
- Licensed master technicians vs. apprentices
- Premium materials vs. standard grade
- 24-hour emergency service vs. business hours only
Data shows explaining value differences converts price-conscious leads into quality-focused customers.
Trust-building timeline:
Week 1-2: Add all credentials and certifications to website Week 3-4: Create team profiles with real photos Week 5-6: Develop and publish guarantee page Week 7-8: Implement rapid response system Week 9-10: Add pricing transparency to website
According to BrightLocal data, businesses that actively manage their online reputation and respond to reviews see significantly higher conversion rates than those that don’t.
FAQ on Lead Generation for Local Businesses
What is local lead generation?
Local lead generation is the process of attracting potential customers within a specific geographic area. It focuses on proximity-based advertising and local search optimization to connect businesses with nearby people actively searching for their services.
How much does local lead generation cost?
Costs vary widely based on industry and competition. Google Ads for local keywords range from $2-$50 per click. Organic strategies like Google Business Profile optimization and local SEO require time investment but minimal direct spend.
How long does it take to see results?
Paid advertising generates leads immediately. Local SEO and organic strategies typically show meaningful results within 3-6 months. Consistency matters more than speed. Building local customer acquisition momentum takes sustained effort.
Which businesses benefit most from local lead generation?
Service-based businesses thrive with local leads. Plumbers, HVAC technicians, dentists, attorneys, restaurants, and salons depend on geographic targeting. Any business requiring physical customer interaction or in-person service benefits from hyperlocal marketing strategies.
What is the most effective local lead generation method?
Google Business Profile optimization delivers the highest ROI for most local businesses. It’s free, directly influences map pack rankings, and captures high-intent searchers. Combine it with review management and local landing pages for maximum impact.
How do online reviews affect local lead generation?
Reviews directly impact local search rankings and customer trust. Businesses with more positive, recent reviews rank higher in the local pack. 93% of consumers read reviews before choosing a local business. Quantity, quality, and recency all matter.
What is NAP consistency and why does it matter?
NAP stands for Name, Address, Phone number. Consistent NAP across all online directories helps search engines verify your business legitimacy. Inconsistencies confuse algorithms and reduce local search ranking potential significantly.
How do I track local lead generation performance?
Use Google Analytics for website conversions, Google Business Profile insights for listing performance, and call tracking for phone leads. Monitor cost per lead, conversion rates, and customer acquisition cost by geographic area and marketing channel.
Should I use paid ads or organic strategies?
Both work best together. Paid ads deliver immediate leads while organic strategies build long-term visibility. Start with geo-targeted advertising for quick wins, then invest in local SEO and content marketing for sustainable, lower-cost lead flow.
How important is mobile optimization for local leads?
Critical. Over 60% of local searches happen on smartphones. Slow-loading pages, poor mobile forms, and difficult navigation kill conversions. Test your site on multiple devices and ensure click-to-call buttons work flawlessly.
Conclusion
Lead generation for local businesses comes down to visibility and trust. Show up where nearby customers search, and give them reasons to choose you over competitors.
Start with your Google Business Profile. Get your NAP consistent across all directories. Build location landing pages that speak directly to each neighborhood you serve.
Collect reviews consistently. Respond to every one.
Track what works through Google Analytics and call tracking. Double down on channels that deliver qualified leads, cut what doesn’t perform.
Local customer acquisition isn’t complicated. It requires consistency, attention to geographic targeting, and genuine community engagement.
Your neighbors are searching right now. Make sure they find you first.