


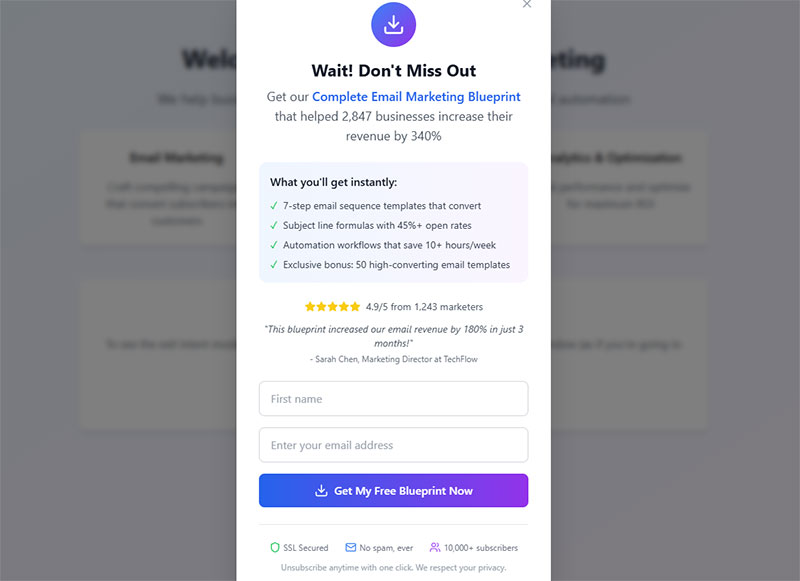
Most lead magnets don’t work. They get downloaded, skimmed for 30 seconds, and forgotten. Meanwhile, your email list fills up with people who will never buy anything. The problem isn’t…
Table of Contents
Most visitors leave your website without taking action. Industry data puts this number around 96-97%.
Exit-intent forms capture a portion of that departing traffic by displaying targeted messages at the exact moment visitors signal they’re leaving. The technology tracks mouse movement toward the browser close button and triggers your offer before they bounce.
This approach works. Cart abandonment popups convert at 17.12% on average. Email capture forms with discount offers recover up to 7% of abandoning visitors.
This guide covers how exit-intent technology detects departure, which popup types convert best for lead generation, and the design and timing settings that separate high-performing campaigns from ignored ones.
What Are Exit-Intent Forms
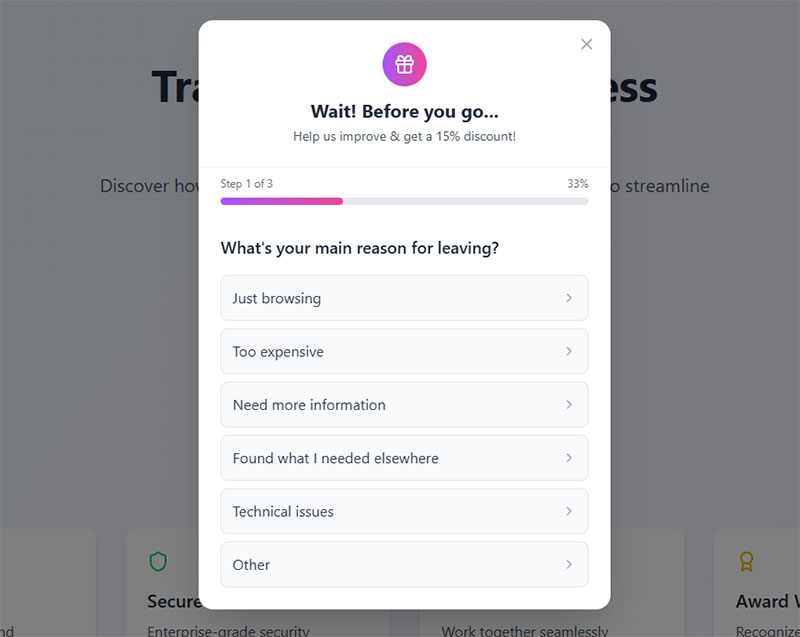
Exit-intent forms are popup forms that appear when a visitor signals they’re about to leave your website.
The technology tracks specific behavior patterns. Cursor movement toward the browser close button. Mouse velocity accelerating toward the upper page boundary. Tab switching on mobile devices.
These forms serve one purpose: capture departing visitors before they bounce.
Unlike traditional popups that interrupt browsing, exit-intent forms activate only at the departure moment. This timing matters. A visitor already engaged with your content receives a final offer precisely when they’ve decided to leave.
The core mechanism relies on JavaScript tracking scripts embedded in your webpage. These scripts monitor cursor trajectory, scroll behavior, and browser interactions in real time.
When the algorithm detects exit signals, it triggers your form overlay within milliseconds.
How Does the Technology Detect Visitor Departure
The detection system works differently across devices.
Desktop tracking monitors mouse movement patterns. The script calculates cursor speed and direction. When your cursor moves toward the browser’s close button or address bar, the system registers exit intent.
Mobile detection uses different triggers entirely:
- Back button press
- Rapid upward scrolling
- Tab switching behavior
- Idle time thresholds (typically 25+ seconds of inactivity)
The JavaScript snippet measures velocity, not just position. A slow cursor drift toward the top doesn’t trigger the popup. Fast, deliberate movement does.
This distinction prevents false positives and keeps the user experience clean.
Desktop vs Mobile Triggers
Desktop exit detection relies on upper page boundary monitoring. The moment your cursor leaves the active browser window area, the popup fires.
Mobile devices lack cursor tracking entirely. Instead, the technology watches for behavioral cues. Pressing the back button. Switching to another app. Scrolling up quickly after reading content.
Some WordPress exit intent popup plugins also use time-based triggers on mobile. If a visitor stays inactive for a set period, the system assumes they’ve lost interest.
The difference matters for form design. Desktop popups can be larger, image-heavy, multi-column. Mobile versions need vertical layouts, minimal fields, and large tap targets.
Core Components of Exit-Intent Forms
Every effective exit popup contains four elements:
Form fields – Keep these minimal. Single email field converts best. Each additional field drops your conversion rate. The goal is frictionless capture, not complete lead qualification.
Call-to-action button – Clear, action-oriented text. “Get My Discount” outperforms “Submit.” Color contrast against the popup background helps visibility.
Close option – A visible X button builds trust. Hiding it frustrates visitors. Google’s interstitial guidelines also penalize popups without easy dismissal on mobile.
Visual design – Match your brand. Consistent typography. Professional imagery when appropriate. Clean whitespace. The popup should feel like part of your site, not an intrusion.
Some forms add countdown timers for urgency. Others include gamified elements like spin-to-win wheels. These additions boost engagement but require testing against simpler versions.
How Does Exit-Intent Technology Detect Visitor Departure
The technology runs in the background using JavaScript. According to Wikipedia, exit-intent uses a JavaScript snippet that measures the speed and direction of the mouse to trigger popups.
A small script loads with your page. It tracks mouse position, scroll depth, and browser focus using event listeners.
Mouse Movement Tracking and Cursor Trajectory Analysis
The technology tracks cursor movements continuously. When the cursor moves toward the top of the browser window (where close buttons live), the popup triggers.
Detection method:
According to Shopify, websites track cursor movements. When the cursor heads toward an exit button, exit-intent technology rapidly renders a popup window.
OptinMonster’s patented technology uses smart tracking algorithms to monitor user behavior in real-time. Arfadia research shows the system considers speed, direction, and distance when deciding whether movement signifies intended departure.
Exit behavior indicators:
- Cursor moving rapidly toward browser top edge
- Movement toward close buttons or navigation controls
- Cursor leaving the viewport entirely
Wisepops confirms the technology relies on JavaScript and analyzes user mouse movements to detect upward motion signaling exit intent.
Speed and Direction Calculations
Velocity and direction determine exit intent. Fast upward cursor movement triggers the popup, while slow movements don’t.
According to BRIX Agency, the system triggers when the cursor moves toward the top of the browser window, typically indicating an attempt to close the tab or navigate away.
FasterCapital research shows the technology monitors continuously for upward or sideways movement indicating an exit attempt.
Mobile Signal Detection
Mobile uses different triggers since there’s no cursor. According to Visme, exit-intent popups work on mobile by tracking behavioral cues like rapid scrolling or attempting to close a tab.
Mobile detection methods:
Back button monitoring triggers when users tap the browser’s back button.
Scroll direction analysis detects rapid upward scrolling, which indicates navigation away from content.
Tab switching detection monitors page visibility API changes when users switch apps or tabs.
Inactivity timers trigger after extended periods without touch activity.
Shopify confirms mobile exit-intent detects actions like tapping the browser’s address bar, switching tabs, and rapidly scrolling up, all indicating intention to leave.
Wisepops suggests combining scroll-up detection with pages-viewed metrics for more accurate mobile triggering.
Arfadia research shows mobile exit-intent achieved 11.07% conversion rates versus 9.69% on desktop, with higher engagement due to full-screen mobile popups.
What Conversion Rates Do Exit-Intent Forms Produce
The data justifies implementation. Exit popups convert at rates that transform abandoning traffic into revenue.
Average popup conversion rate sits at 4.65% in 2025, according to Wisepops research. That’s up from 4.01% in 2024. The trend line keeps climbing.
But averages hide the real story.
Average Popup Conversion Benchmarks
The top 10% of popup campaigns hit 19.77% conversion rates. Nearly five times average performance.
Performance separators:
Targeting precision. Offer relevance. Design quality. Timing optimization.
Cart abandonment exit popups specifically convert at 17.12% on average per OptiMonk data. These target visitors with demonstrated purchase intent who’ve added items but haven’t checked out.
Compare this to baseline website conversion rates of 3.68%. Exit popups can triple your capture rate on departing traffic.
Exit-Intent Specific Performance Data
Exit-intent timing creates a psychological moment. The visitor has mentally committed to leaving. Your offer interrupts that pattern.
Research from Conversion Sciences shows well-crafted exit messages save 10-15% of abandoning visitors.
Discount offer performance:
- 7% of abandoning visitors convert to email subscribers when offered a discount (Getsitecontrol data)
- Up to 13.5% of abandoned sales recover when checkout coupons appear
- Some campaigns achieve 20% conversion rates with prize incentives (ReferralCandy research)
Gamified popups push even higher. Spin-to-win wheels average 13.23% conversion rates according to OptiMonk. The interactive element increases engagement time with the popup itself.
Factors Affecting Conversion Rates
Not all exit popups perform equally. Several variables determine success.
Offer value: Discounts outperform generic newsletter signups. Free shipping beats percentage-off for many ecommerce stores.
Form field count: Single-field forms convert dramatically better. Wisepops shows one-field popups achieve 5.77% CVR versus 4.60% for four fields.
Visual elements: Popups with images convert at 11.09% versus 11.08% for text-only, per OptiMonk data. The difference is minimal, making offer value more critical than imagery.
Urgency indicators: Countdown timers push conversion rates to 14.41% versus 9.86% without them, according to OptiMonk research.
Targeting rules: URL-targeted popups hit 5.80% CVR compared to 2.30% for untargeted campaigns (Wisepops). That’s 152% improvement from basic personalization.
Position impact: Bottom-center placement leads with 12.88% CVR in 2025 testing, dramatically outperforming top-right at 0.67% (Wisepops data).
Timing optimization: Popups displayed between 11-15 seconds perform best for user experience while maintaining high conversion, per Wisepops research.
What Types of Exit-Intent Forms Work for Lead Generation
Different goals require different popup formats.
Your lead generation strategies should match the popup type to visitor intent and your conversion objectives.
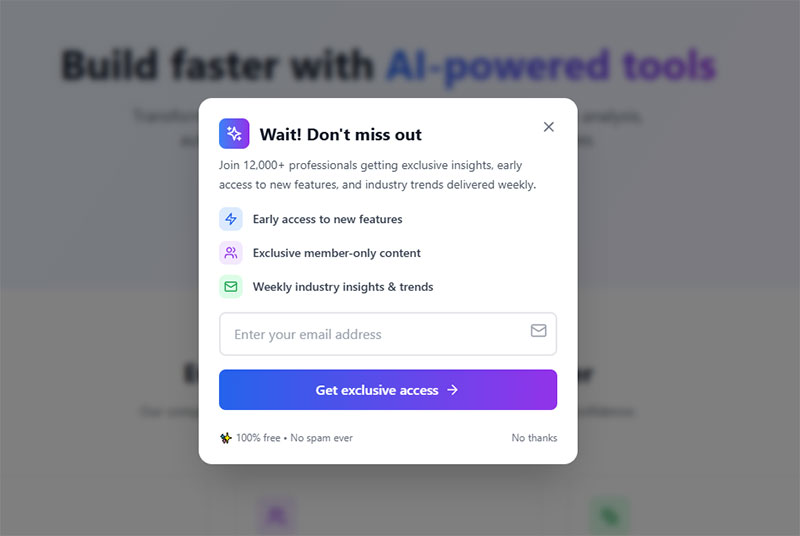
Email Capture Forms With Lead Magnets
The classic approach. Offer something valuable in exchange for an email address.
OptiMonk data shows that adding a lead magnet to email popups raises conversion rates significantly. Email popups without incentives convert at just 5.10%, while adding a discount or lead magnet bumps this to 7.5%–7.65%.
Effective lead magnets for exit popups include:
- Ebooks and guides relevant to the page content
- Checklists and templates
- Free tools or calculators
- Exclusive video content
- Course previews
Match content to visitor intent. Research from GetResponse shows that 58.6% of marketers report higher conversion rates with short-form written content like checklists and ebook samples compared to lengthy guides. A fitness ebook on a cooking blog converts poorly.
ActiveCampaign does this well. Their exit popup on email marketing pages offers a welcome email series guide. Direct relevance to visitor interest.
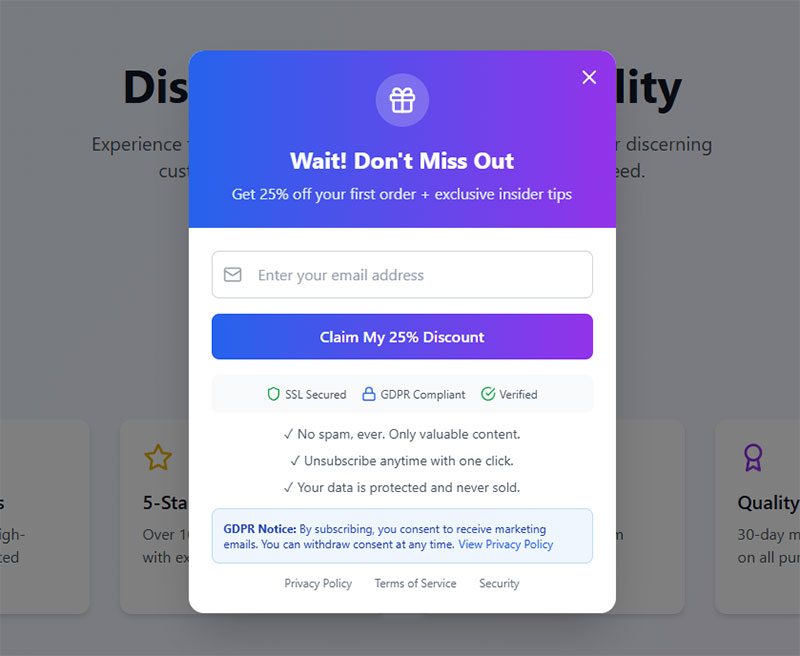
Discount and Coupon Code Offers
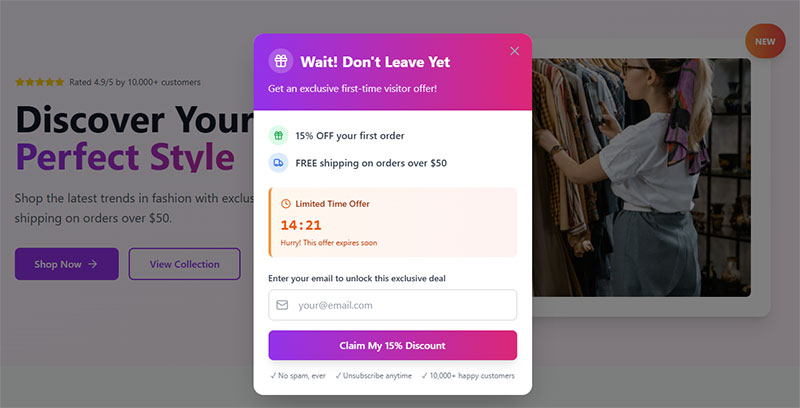
For ecommerce, discounts dominate exit-intent strategy.
Price hesitation causes most cart abandonment. According to Baymard Institute, 70.19% of online shopping carts are abandoned, with 47% of shoppers citing unexpected costs as their reason for leaving. A last-second discount removes that barrier.
Common formats include:
- Percentage off (10-20% typical)
- Dollar amount discounts
- Free shipping thresholds
- First-order exclusive codes
The discount popup works particularly well on checkout pages where checkout optimization matters most. Research by Voucherify indicates that abandoned cart offers recover between 3% and 11% of orders, with 5% to 10% discounts showing significant uplift in recovery rates.
Display the code directly when possible. Requiring email retrieval adds friction and risks the visitor leaving anyway.
Free shipping converts. Data shows 84% of shoppers made a purchase specifically because shipping was free, and 78% of customers will spend more to qualify for free shipping.
Gamified Spin-to-Win Wheels
Gamification taps into psychological engagement differently than static offers.
Analysis from OptiMonk reveals that spin wheels convert at 13.23% on average. Higher than standard discount popups at 5.10% without incentives.
The format works because it adds entertainment value. Visitors engage with the wheel itself, not just the offer. This increases time spent and emotional investment in the outcome.
Random reward psychology also plays a role. The chance of winning something bigger than the minimum prize motivates action.
Best for: Ecommerce, B2C brands, younger demographics. Less appropriate for professional services or B2B where playfulness might undercut credibility.
Survey and Feedback Collection
Not every exit popup aims for immediate conversion.
Understanding why visitors leave provides data for improving your overall site performance. Short feedback forms at exit capture this intelligence.
Kennedy Blue uses exit surveys effectively. They recognize that improving customer experience leads to better long-term conversion rates.
Keep surveys brief. One to three questions maximum. Multiple choice when possible.
Use website feedback survey questions focused on specific barriers: pricing concerns, missing information, trust issues, or comparison shopping behavior.
According to research, 82% of customers compare prices online before purchasing, and 48% abandon carts because they were just browsing. These insights help you understand which friction points to address.
Demo and Free Trial Offers
For SaaS and service businesses, exit-intent offers shift toward engagement rather than purchase.
Zendesk triggers demo request popups when visitors exit their pricing page. The logic: someone leaving after viewing prices may have objections. A personalized demo addresses those directly.
Free trial offers work similarly. Remove the commitment barrier. Let the product sell itself through usage.
These popups often work well as part of broader lead generation for SaaS strategies where the sales cycle requires nurturing.
Timing matters. Popupsmart data shows that campaigns using behavior-based triggers (time-on-page, scroll depth, exit intent) outperform static-delay triggers by 35-40%.
Which Industries and Websites Benefit From Exit-Intent Forms
Exit-intent technology applies across verticals, but implementation varies significantly.
Ecommerce and Retail
The highest-impact use case. Cart abandonment represents lost revenue. Exit popups recover a measurable percentage.
OptiMonk data shows cart abandonment popups achieve a 17.12% conversion rate, the highest among all popup types. Research from Conversion Sciences indicates well-crafted exit messages can save between 10% and 15% of abandoning visitors.
Typical applications:
- Checkout page discount offers
- Free shipping threshold reminders
- Cart save notifications (email the cart for later)
- Product recommendation popups
Lead generation for ecommerce relies heavily on capturing email addresses from browsers who aren’t ready to buy today. Exit popups build that list efficiently. Data from Getsitecontrol shows you can convert up to 7% of abandoning visitors into email subscribers with a discount offer, and save up to 13.5% of abandoned sales with checkout coupons.
Brands like Fashion Nova, Bauble Bar, and PortraitFlip use exit-intent across their product pages with discount wheels and exclusive first-order offers.
B2B SaaS Companies
Longer sales cycles require different tactics.
B2B exit popups often offer:
- Product demos
- Free trials
- Whitepaper downloads
- Consultation bookings
Analysis from HockeyStack across 31 million website visitors shows that pricing pages average a 39% bounce rate, significantly lower than typical site averages. The goal shifts from immediate sale to lead capture forms that feed nurturing sequences.
Demo conversion benchmarks: Research indicates that average B2B SaaS demo landing page conversion rates hover around 2%, while Chili Piper data shows companies using instant booking technology can convert 66.7% of qualified form submissions into booked meetings.
Pricing page exits get special attention. A visitor leaving your pricing page without action likely has objections. Demo offers address those directly.
Content Publishers and Blogs
Traffic is the product. Email subscribers represent recurring attention.
Exit popups on blog content offer newsletter signups, content upgrades specific to the article topic, or access to member-only content.
Newsletter signup performance: Research suggests a 2% email capture rate is healthy for content sites. Testing from Getsitecontrol found that fullscreen popups triggered at 50% scroll depth converted 3.41% of blog readers, outperforming modal popups (2.95%) and sidebar forms (2.61%).
Help Scout uses exit popups promising more articles like the one just read. Simple relevance matching.
The approach works for building audiences that can later be monetized through sponsorships, products, or affiliate relationships. Data from Whop shows typical conversion rates from free to paid newsletters range from 5% to 10%.
Service Businesses
Local service providers benefit from consultation and quote request popups.
Popupsmart analysis of local business campaigns shows approximately 27% conversion rates, primarily through click-to-call, map, or appointment popups. This higher performance reflects high visitor intent (users are usually ready to book or call).
Exit-intent lead generation for contractors might offer free estimates. Lead generation for law firms could provide case evaluations.
The pattern applies across:
- Lead generation for healthcare
- Lead generation for real estate
- Lead generation for financial advisors
- Lead generation for coaches
Service businesses typically ask for more information in their lead generation forms. Phone numbers. Project details.
Balance form length carefully. Research from Focus Digital shows that B2B lead magnets convert 8-12% of visitors depending on offer strength. When offers include real-time personalization (location or service type), conversion rates climb even higher.
This requires balancing form length against conversion rate using proper form fields for capturing high-quality leads.
What Design Elements Increase Exit-Intent Form Conversion
Design decisions directly impact whether visitors complete your popup or dismiss it.
Every element either reduces friction or adds it. There’s no neutral ground.
Single Field vs Multiple Fields
Fewer fields mean higher conversions. The data is unambiguous.
Research from Imagescape showed a 120% jump in form conversion rate after eliminating eight form fields, bringing the total down to just four. Analysis from HubSpot reveals forms with three fields achieve the highest conversion rate (slightly over 25%), followed by five fields (above 21%).
Each additional field creates a decision point. More decisions mean more abandonment.
Single field performance: Data from Martech Zone shows forms with a single field achieve a 50% completion rate. Research from DiviFlash found that popups with one field converted 4.4% of visitors, while two-field popups dropped to 2.85%.
For exit popups specifically, visitors have already decided to leave. They’re giving you seconds, not minutes. Respect that constraint.
If you need more information, consider multi-step forms that collect email first, then request additional details on the success screen. WPForms data shows multi-step forms have an 86% higher conversion rate, though only 40% of marketers use them.
Image Inclusion and Visual Elements
Popups with images convert significantly higher than text-only versions.
Research from Getsitecontrol shows adding an image can increase email popup conversion rates by 63.49% on desktop. Popups with images engaged 7.49% of visitors, while those without images saw engagement drop to 5.82%.
Analysis from Wisepops confirms this trend. Popups with images converted 5.46% of visitors versus 3.22% for text-only versions. The top 10% of popup campaigns with images converted 22.12% of visitors on average.
Effective image choices:
- Product photos showing what they’ll receive
- Human faces looking toward the CTA button
- Lead magnet mockups (ebook covers, template previews)
- Brand lifestyle imagery matching your positioning
Mobile consideration: Skip images on mobile if they slow load times. Performance matters more than aesthetics on smaller screens.
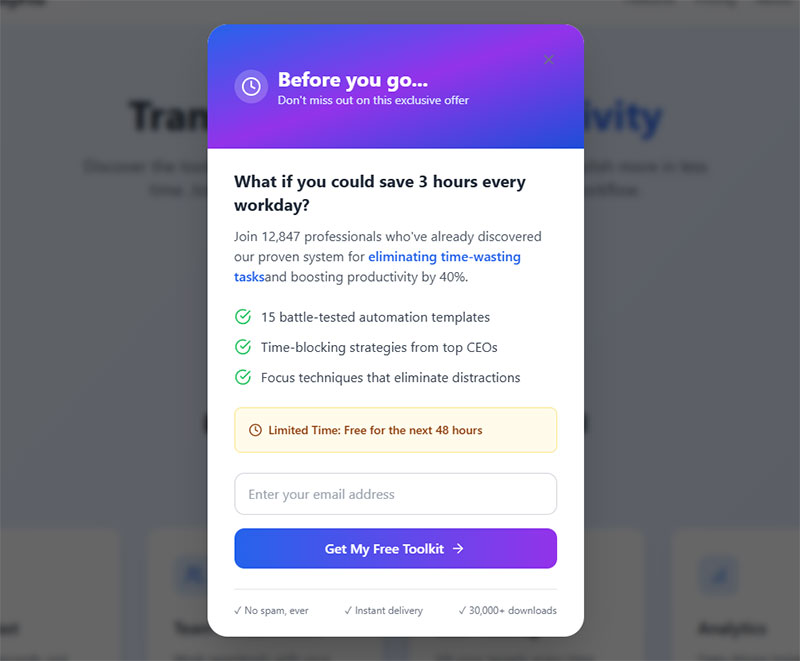
Countdown Timers and Urgency Elements
Countdown timers push conversion rates to 14.41% versus 9.86% without them.
OptiMonk research confirms urgency works. Robert Cialdini’s scarcity principle applies directly to popup psychology. Research from Sleeknote found popups with countdown timers (5.17%) convert 25.48% better than campaigns without timers (4.12%).
Limited-time framing options:
- “Offer expires in 10:00”
- “Today only”
- “First 100 subscribers”
- “Flash sale ends midnight”
Critical requirement: The timer must feel real. Fake urgency that resets on page refresh damages trust and brand credibility. Data from Wisepops shows adding a countdown increased conversion from 4.63% to 7.34%.
Popup Positioning and Placement
Position impacts visibility and user experience differently.
2025 performance data from Wisepops by position:
- Bottom-center: 12.88% CVR (highest)
- Center-right: 6.40% CVR
- Top-left: 5.07% CVR
- Center positions: 2.78-4.01% CVR
- Top-right: 0.67% CVR (lowest)
Bottom positioning feels less intrusive. Visitors can still see page content above. This psychological accessibility improves engagement.
Center-screen overlays demand immediate attention but feel more aggressive. Research from OptiMonk shows fullscreen popups average 14.40% conversion rates because they effectively capture visitor attention. Test both approaches against your audience.
Close Button Visibility
A clearly visible close button builds trust rather than trapping visitors.
Google penalizes mobile popups without easy dismissal. Beyond SEO, hidden close buttons frustrate users and damage brand perception.
Best practices for close buttons:
- Standard X icon in top-right corner
- Sufficient size for easy tapping on mobile (minimum 44×44 pixels)
- High contrast against popup background
- “No thanks” text link as alternative dismissal
Opt-out button performance: Research from Getsitecontrol found popups with two action buttons (one being an opt-out) had 14.34% higher conversion rates (8.05% versus 7.04%) compared to single-button popups.
Some marketers try hiding close buttons to force engagement. This backfires. Frustrated visitors remember the experience negatively.
How Should Exit-Intent Forms Differ Between Desktop and Mobile
Desktop and mobile require separate campaigns. Responsive design alone isn’t enough.
The fundamental interaction model differs. Cursor tracking versus behavioral signals. Large screens versus constrained viewports.
Desktop Design Considerations
Desktop popups have space advantages. Use them strategically.
Analysis from Popupsmart shows desktop popups convert at 42% while mobile converts at 38%. Research from Statista reveals desktop users spend an average of 6.7 minutes on-site compared to mobile’s 3.5 minutes. That extra attention window gives popups more time to land.
Effective desktop formats:
- Full-screen overlays for maximum attention
- Lightbox popups with dimmed backgrounds
- Multi-column layouts with image and form side-by-side
- Larger imagery and detailed copy
Desktop performance: Data from Wisepops shows desktop-only campaigns converted 2.67% versus mobile-only campaigns at 3.75%. However, top-performing campaigns show desktop at 15.27% and mobile at 17.99%.
Desktop visitors expect visual richness. Sparse popups can feel unfinished or low-effort.
Form fields can include placeholder text for guidance without cluttering the design.
Mobile Design Requirements
Mobile exit popups demand different thinking entirely.
Research from Sleeknote found mobile popups (5.60%) outperform desktop popups (2.86%) by 97.18%. However, conversion goals differ by device. Mobile users browse in shorter bursts, averaging 4.8 sessions per day compared to desktop’s 2.1 sessions.
Constraints to address:
- Limited screen real estate
- Touch interaction (larger tap targets needed)
- Variable connection speeds
- Google interstitial penalties
Tap target requirements: Studies from Smashing Magazine found buttons placed within the natural thumb zone (lower middle of the screen) saw up to 25% higher interaction rates on mobile. Data from Popupsmart shows popups optimized for thumb-reach recorded a 12% higher interaction rate than upper-screen layouts.
Recommended mobile formats:
- Floating bars at top or bottom
- Slide-in widgets from screen edge
- Bottom-aligned sticky popups
- Compact centered overlays (not full-screen)
Google’s mobile interstitial penalty: Google penalizes popups that block main content immediately after users click from search results. Industry best practice suggests banners should take up no more than 15-25% of the screen on mobile devices. Exit-intent popups triggered when users attempt to leave are not penalized.
Following mobile form best practices means single-column layouts, minimal fields, and thumb-friendly button placement. Keep CTAs and close buttons within the bottom 40% of the viewport.
Separate Campaigns for Each Device
Creating device-specific campaigns outperforms responsive-only approaches.
What works on desktop often fails on mobile. Research from Getsitecontrol shows popups with images converted 7.49% on desktop but performance varies significantly on mobile where load speed matters more.
Mobile optimization requirements: Data shows even a 1-second delay in popup load time can lower engagement by 7% on mobile. Keep mobile copy under 15 words. Use concise messaging that respects limited attention spans.
Build two versions:
- Desktop: Image-forward, potentially multi-field, detailed copy
- Mobile: Minimal, fast-loading, single-field, brief messaging
Your popup software should allow device targeting. Show different creative to different audiences.
Behavioral differences: Mobile bounce rates average around 54.3% versus desktop’s 42.8%. Mobile users exhibit “micro-moment engagement,” reacting instantly but abandoning just as fast if friction appears. Desktop sessions last significantly longer (996-1,918 seconds versus mobile’s 704-775 seconds).
Track performance separately. Desktop and mobile conversion rate benchmarks differ significantly across industries. Mobile devices now account for 59.6% of global web traffic, but desktop conversion rates (4.3%) still outpace mobile (2.2%).
What Triggers and Timing Settings Work Best
Trigger configuration determines when visitors see your popup. Get this wrong and conversions suffer regardless of offer quality.
Display Timing Benchmarks
Showing popups between 0-5 seconds performs well in raw conversion data but risks user experience damage.
Research from Wisepops shows campaigns displayed between 0-5 seconds performed exceptionally well, though this timing isn’t ideal for visitor experience. The safer option that also performed well was 11-15 seconds.
Optimal timing by context:
- Blog content: After 30-60 seconds of reading
- Product pages: After scroll depth indicates engagement
- Checkout pages: On exit intent only (no time delay)
Timer vs scroll triggers: Data from Sleeknote reveals timer-led triggers (4.42%) outperform scroll-based triggers (2.64%) by 67.42%. Research shows 6 seconds is the optimal timing for timer-based popups.
Analysis from Popupsmart found campaigns using time-on-page triggers outperformed others by up to 25%. Test time-on-page triggers around 25-45 seconds as a baseline for general lead generation popups.
Visitors who’ve engaged longer convert at higher rates. Someone who spent 3 minutes reading your content is more qualified than someone who bounced in 10 seconds.
Patience pays. Let visitors meet their goals before interrupting.
Scroll Depth Triggers
Scroll depth determines engagement level before showing popups.
Research from Drip found the top 10 highest-performing popups by scroll percentage appear after visitors scrolled at least 35% of a page. Data shows the sweet spot is 35-50% scroll depth, with conversion rates ranging from 2.5% to 3.35%.
Performance by scroll depth:
- 10% scroll: 1.99% conversion (minimum effective depth)
- 35-50% scroll: 2.5-3.35% conversion (optimal range)
- 80% scroll: 1.62% conversion (too late)
Popupsmart data indicates scroll-trigger campaigns typically convert around 28%, performing well when aligned with content upgrades. However, Wisepops research shows scroll-based popups have the lowest conversion at 2.18% among all trigger types.
Context matters: Scroll depth triggers work best on content-rich sites (blogs, guides) rather than transactional pages.
Page View Triggers
Popups appearing on the second page view hit 28.98% CVR according to Wisepops. The highest performing trigger setting.
Why? Second-page visitors have demonstrated interest. They clicked deeper into your site. First-page visitors might be accidental arrivals.
Four-page delay triggers convert at 10.69%. Still strong, though lower volume.
Page view triggers work well combined with exit intent. Show the popup on exit, but only after visitors have viewed at least two pages.
Click-Based Triggers
Click-triggered popups achieve the highest conversion rates.
Research from Wisepops shows popups triggered by clicks convert at 28.79%, indicating visitors who engage with specific elements are highly receptive to offers. Analysis confirms on-click popups have shown conversion rates of 22% compared to other trigger types.
Other trigger performance from Wisepops:
- Hover-based: 17.37% conversion
- Custom events (cart add): 9.97%
- On-landing: 4.97%
- Exit intent: 2.81% (but second-highest volume)
URL-Based Targeting Rules
URL targeting produces 5.80% CVR versus 2.30% without targeting according to Wisepops. A 152% improvement from basic personalization.
Match offers to page context:
- Pricing page exit → Demo request or discount
- Blog post exit → Content upgrade related to article topic
- Product page exit → Product-specific discount code
- Cart page exit → Cart abandonment recovery
Different pages signal different intent levels. Your popup messaging should acknowledge this.
Visitors reading your blog need nurturing. Visitors abandoning checkout need immediate incentive.
Frequency Capping and Repeat Visitor Settings
Showing the same popup repeatedly annoys visitors and damages brand perception.
Implement frequency limits:
- Maximum one popup per 24-hour period
- Cookie-based tracking to remember dismissals
- Different popups for returning visitors versus new arrivals
- Skip popups entirely for converted visitors
Never show an exit popup to someone who already completed the action. If they signed up for your newsletter, don’t ask again.
Behavior-based triggers outperform: Data from Popupsmart shows campaigns using behavior-based triggers (time-on-page, scroll depth, exit intent) outperformed static-delay triggers by 35-40%.
Use cookies to track interactions across sessions. First-time visitors might see a discount offer. Returning visitors who declined could see a different value proposition.
How Do Exit-Intent Forms Reduce Cart Abandonment
Cart abandonment represents the most direct revenue recovery opportunity for exit popups.
Research from Baymard Institute shows the average cart abandonment rate is 70.19% across ecommerce. That means 7 out of every 10 shoppers leave without completing their purchase. According to analysis, $260 billion worth of lost orders are recoverable through better checkout design and cart recovery strategies.
The timing is perfect. Visitors have items in their shopping basket. They’ve demonstrated purchase intent. Something stopped them from completing checkout.
Cart Page Exit Detection
Exit popup software can identify visitors with items in cart and serve targeted messages specifically to them.
This targeting matters. A generic newsletter popup for someone abandoning a $200 cart wastes the opportunity. A “Complete your order and save 15%” message addresses their specific situation.
Cart abandonment popup performance: Data from OptiMonk shows cart abandonment popups convert at 17.12% on average, the highest conversion rate among all popup types. Research indicates exit-intent popups can recover between 10% and 15% of abandoning visitors.
Platforms like Shopify and WooCommerce integrate directly with exit popup tools. Cart contents can trigger personalized messaging.
Some implementations show the actual cart items in the popup. Visual reminders of what they’re leaving behind.
Discount Code Strategies
Price hesitation causes most cart abandonment. Discounts address this directly.
Research from Baymard reveals 48% of shoppers abandon their cart due to unexpected extra costs (shipping, taxes, fees). Free shipping can reduce cart abandonment by as much as 18%, and customers are 88% more likely to complete their purchase when they see free shipping options.
Effective discount approaches:
- Percentage off total order (10-20% typical)
- Dollar amount discounts for higher carts
- Free shipping thresholds
- Time-limited codes creating urgency
Discount offer data: Analysis shows 81% of offers in cart abandonment emails are percentage discounts, 12% are dollar amount discounts, and 5% offer free shipping. Research indicates offering free shipping can reduce abandonment by 18%.
Display codes directly in the popup when possible. Requiring email submission to receive the code adds friction.
Direct display keeps shoppers on-site. They can apply the code immediately and complete checkout without leaving to check email.
Free Shipping Threshold Notifications
Free shipping is the primary motivator for online purchases. Exit popups can leverage this powerfully.
Data shows 80% of customers will add more items to qualify for free shipping, demonstrating the power of free shipping thresholds in increasing order value. Research confirms 67% of shoppers have abandoned their carts over high shipping costs.
Common tactics:
- “You’re $15 away from free shipping”
- “Free shipping on orders over $50 (you’re almost there!)”
- “Complete your order for free standard delivery”
This approach works especially well for carts slightly under your free shipping threshold. It often increases average order value as shoppers add items to qualify.
Toms uses free shipping messaging prominently in their exit popups. Simple, direct, addressing the top checkout concern.
Email Capture for Abandoned Cart Recovery
Sometimes visitors won’t complete checkout regardless of your exit offer. Capture their email for follow-up campaigns.
The popup trade: Save their cart in exchange for email address.
Email recovery performance: Research shows cart abandonment email open rates average 39-43%, with click-through rates around 21-23%. Approximately 10-11% of shoppers who receive an abandonment email complete their purchase. Studies indicate 50% of email clicks result in completed purchases.
This enables:
- Automated abandoned cart email sequences
- Personalized recovery messages with cart contents
- Time-delayed discount escalation (10% now, 15% in 24 hours)
- Retargeting through email marketing platforms
Recovery strategies: Analysis reveals businesses can recover about 10% of lost revenue through abandoned cart emails. High-performing recovery strategies with automated emails, retargeting ads, and discounts can recover up to 20% of potential lost revenue.
SMS recovery data: Research shows exit-intent popup strategies combined with SMS can recover up to 16.4 orders for every 100 SMS messages delivered, using a 60-minute delay.
CRM integration with tools like Klaviyo, Mailchimp, or ActiveCampaign automates the recovery workflow.
Even if conversion doesn’t happen immediately, you’ve captured the lead for nurturing. Among all email marketing campaigns, abandoned cart flows drive the highest average repeat purchase rate ($3.65) and the highest average placed order rate (3.33%).
What Copy and Messaging Converts Departing Visitors
Words matter. The right headline stops the exit. The wrong one gets ignored.
You have perhaps two seconds of attention. Every word must earn its place.
Headline Patterns That Work
Interrupt patterns stop the mental exit process.
Effective headline structures:
- “Wait!” (pattern interrupt)
- “Before you go…” (acknowledges their intent)
- “Don’t leave empty-handed” (implies missed value)
- “Forgot something?” (creates curiosity)
- “One more thing…” (casual, less salesy)
Short headlines outperform long ones. Five words or fewer when possible.
Headline impact: Research shows 90% of visitors who read a page headline also read the CTA copy, demonstrating the critical importance of headline effectiveness.
The headline’s job is stopping the exit, not explaining the offer. That comes in supporting copy.
Value Proposition Clarity
State your offer immediately after the headline. No buildup. No context-setting.
Bad: “We appreciate you visiting our store today. As a thank you for stopping by, we’d like to offer you…”
Good: “15% off your first order. Code: WELCOME15”
Visitors scanning your popup should understand the offer within one second. If they have to read carefully to figure it out, you’ve already lost them.
Mobile copy requirements: Analysis from Popupsmart shows mobile popups need concise copy under 15 words. Even a 1-second delay in popup load time can lower engagement by 7% on mobile.
Single Clear Call-to-Action
One popup. One action. One button.
Multiple CTAs split attention and reduce overall conversion. “Sign up AND follow us on social AND check out our blog” confuses visitors.
CTA performance data: Research indicates clear, specific CTAs can boost conversion rates by up to 161%. Relevant, well-placed CTAs increase revenue by an average of 83%.
CTA button text matters:
- “Get My Discount” outperforms “Submit”
- Action verbs increase clicks
- First-person phrasing (“Get My…” vs “Get Your…”) often converts better
Action word impact: Studies show using action words in CTAs can deliver an increase in conversion rates of 122%. Research from Medium confirms action-oriented language significantly outperforms generic submit buttons.
Button design matters: Analysis reveals CTA buttons outperform text links by 200% on mobile. Data from Copyblogger shows CTAs in button shape generate a 45% increase in clicks.
Button color should contrast sharply with popup background. The CTA needs to be the most visually prominent element.
Negative Opt-Out Text
The dismiss option is often overlooked copy real estate.
Standard: “No thanks” or X button
Strategic: “No thanks, I prefer paying full price” or “I don’t want free shipping”
This psychological technique makes declining feel like missing out. It’s mildly manipulative. Use judiciously based on your brand voice.
Some audiences find this tactic annoying or condescending. Test against neutral dismiss language.
Exit-intent CTA recovery: Research from OptinMonster shows exit-intent CTAs recover 10-15% of abandoning visitors when properly executed.
Personalization Based on Behavior
Dynamic popup content based on visitor actions converts higher than static messaging.
Personalization performance: Data from Wisepops shows campaigns using custom properties to target specific groups convert almost 10% of engaged visitors. Best-performing campaigns using custom targeting properties converted 18.32% of visitors.
Research from DiviFlash reveals personalized popups have a 5.75% conversion rate. Personalizing based on cart value can increase conversions by 49%.
AI personalization impact: Segment’s 2025 report shows AI-powered dynamic CTAs tailored to individual users can improve conversion rates by up to 44%. HubSpot data indicates personalized CTAs convert 42% more visitors compared to generic CTAs.
Personalization opportunities:
- Product name inclusion (“Still thinking about the Blue Widget?”)
- Category-specific offers (different discounts for different product lines)
- Cart value acknowledgment (“Your $127.50 cart is waiting”)
- Browsing history references
Returning visitor strategy: Analysis from Zendesk shows 75% of customers expect personalization based on previous interactions. Research indicates new visitors have nearly 1.5× higher conversion potential than returning visitors, but personalized messaging for returning visitors (“Welcome back, Alex — here’s what’s new”) performs best.
The more specific your popup feels, the more relevant it becomes. Generic popups feel like spam. Personalized popups feel like service.
Conversational popup performance: OptiMonk data shows conversational popups that segment visitors through questions achieve a 15.2% conversion rate, while also collecting valuable preference data.
How to Measure Exit-Intent Form Performance
Without measurement, you’re guessing. Data tells you what works.
Primary Metrics to Track
Focus on these core performance indicators:
- Conversion rate: Form submissions divided by popup displays
- Submission rate: Completed forms versus started forms
- Bounce rate change: Did adding the popup reduce exits?
- Revenue attribution: Sales directly tied to popup offers
Performance benchmarks: Data from Wisepops shows the average popup conversion rate is 4.65% in 2025, up from 4.01% in 2024. Top-performing campaigns (top 10%) averaged 19.77% conversion rate, five times higher than the average.
Analysis from Popupsmart reveals campaigns showed 12% year-over-year improvement in conversion rates, likely due to better targeting and UX improvements. The average interaction rate (how often users engage before closing) is 50.9%, with an average conversion rate of 31.6%.
Most popup tools provide built-in analytics. OptinMonster, Wisepops, and Sumo all include dashboards for tracking these metrics.
Google Analytics event tracking can supplement platform data for cross-referencing.
Secondary Engagement Metrics
Beyond raw conversion, measure experience impact:
- Time on site after popup display
- Pages per session for popup converters versus non-converters
- Popup dismissal rate and method (X button versus clicking outside)
- Mobile versus desktop performance split
Device performance comparison: Research shows mobile popups outperform desktop by 42.04% in engagement. Mobile devices see a 10% click-through rate versus desktop’s 7.09%. However, desktop conversion rates (3.74%) still slightly edge out mobile (4.27%) in some studies.
High dismissal rates suggest targeting or offer problems. Low time-on-site after popup suggests potential annoyance.
A/B Testing Framework
Never assume your first popup is optimal. Testing reveals improvement opportunities.
A/B testing impact: Research from DiviFlash shows companies using A/B testing for popups achieve a 5.34% conversion rate, compared to just 3.4% without it. This represents a 57% improvement through testing.
Data from Wisepops reveals the top 10% of popup campaigns using A/B testing converted 22.02% of visitors on average in 2025. Analysis indicates marketers who consistently test their CTAs see about a 28% lift in conversion performance.
Elements worth testing:
- Headlines (different hooks and angles)
- Offer type (discount versus free shipping versus content)
- Design (image versus no image, layout variations)
- CTA button text and color
- Timing and trigger settings
- Popup position and size
Testing best practices: Research shows 68.2% of companies execute fewer than four A/B tests monthly. Data indicates that in A/B testing, valid statistics can be obtained with only 5,000 unique visitors.
Change one element per test. Multiple changes obscure which variable affected results.
Run tests until reaching statistical significance. Platform calculators help determine required sample sizes.
Specific element improvements: Analysis shows popups without discounts convert at 3.82%, while those offering discounts achieve 8.53%. Adding countdown timers increased conversion from 4.63% to 7.34%, a 58% improvement.
Lead Quality Assessment
Volume matters less than quality for lead generation.
Track downstream metrics:
- Email open rates from popup subscribers versus other sources
- Click-through rates on follow-up sequences
- Conversion to sale for popup-captured leads
- Lifetime value comparison across acquisition channels
A popup converting at 15% but producing low-quality leads underperforms one converting at 8% with highly engaged subscribers.
Year-over-year improvements: Data from Popupsmart shows mobile conversion rates improved approximately 15% year-over-year, largely due to better responsive templates and shorter forms. Behavior-based triggers (time-on-page, scroll depth, exit intent) outperformed static-delay triggers by 35-40%.
Connect popup data to your CRM for full-funnel visibility.
Industry context: Research indicates the average landing page conversion rate across all industries is 2.35%. Companies implementing A/B testing have observed an average increase of 25% in conversion rates. A/B testing has led to a 30% boost in user engagement metrics, including time spent on page and click-through rates.
What Mistakes Reduce Exit-Intent Form Effectiveness
Common errors tank popup performance. Avoid these pitfalls.
Showing Popups Before Engagement
Triggering popups immediately frustrates visitors who haven’t consumed your content yet.
Research from Wisepops shows popups displayed between 0 and 5 seconds performed well technically but damaged user experience. The safer option was between 11 and 15 seconds. According to Sleeknote data, timer-led triggers perform 67.42% better than scroll-based triggers, with 6 seconds being optimal.
Let visitors engage first. Wait minimum 30 seconds or 50% scroll depth before exit intent triggers activate.
Exception: High-intent pages like pricing or checkout can trigger earlier since visitor intent is already established.
Too Many Form Fields
Every additional field reduces conversion.
Exit popups demand minimal attention spans. Research from Drip analyzing users’ popups with one to five input fields found conversion rates dropping from 4.4% (one field) to 2.85% (two fields). The pattern holds, with analysis showing that two fields outperform three by over 200%.
Single email field is ideal for most exit-intent lead capture forms.
If you need more data:
- Use progressive profiling
- Capture email first
- Request additional information in follow-up sequences or confirmation page
Check your form validation settings. Overly strict validation creates friction and abandonment. According to Zuko data, password fields have a 10.5% abandonment rate, while email and phone fields show 6.4% and 6.3% respectively.
Displaying to Already-Converted Visitors
Nothing annoys customers more than popups asking them to repeat completed actions.
If someone subscribed to your newsletter, don’t show the newsletter popup again. If they completed a purchase, skip the cart abandonment message.
Use cookies and session data to exclude converted visitors. Your popup software should support this targeting. Smart suppression shows you respect visitor actions and builds positive brand perception.
Same Popup to All Visitors
Generic popups underperform targeted ones dramatically.
Segment your audience:
- New versus returning visitors
- Different pages indicate different intent
- Cart value tiers deserve different offers
- Traffic source can indicate interest level
A visitor from a Google search for “buy running shoes” deserves different treatment than someone clicking through from Instagram. Consider using quizzes or conditional logic to personalize popup content based on visitor responses.
According to Wisepops data, popup campaigns with URL targeting achieve a 5.80% conversion rate, while those without URL targeting convert at just 2.30%. This represents a 152% higher conversion rate.
Ignoring Mobile Optimization
Over half of web traffic is mobile. Popups that work only on desktop miss most of your audience.
Research from Wisepops shows popups created only for mobile devices had a 3.75% conversion rate versus 2.67% for desktop-only. Mobile popups engage on average 42.04% better than popups on desktop, according to Getsitecontrol data.
Common mobile failures:
- Popups too large to close easily
- Form fields too small for finger tapping
- Images slowing load time
- Text too small to read
Build separate mobile campaigns. Test on actual devices, not just browser emulators. Studies show mobile users convert email popups at 6.57% versus 3.77% on desktop.
Non-Compliance With Privacy Regulations
GDPR and CCPA require specific consent mechanisms for data collection.
As of May 2023, the largest share of GDPR penalties issued was due to non-compliance with general data processing principles. Since 2018, this violation has led to more than €1.67 billion in fines.
Ensure your exit popups include:
- Clear privacy policy links
- Explicit consent checkboxes where required (no pre-checked boxes)
- Data usage explanations
- Easy opt-out mechanisms
Building GDPR compliant forms protects your business legally and builds visitor trust. Tests showed a 25.82% decrease in email signups when a mandatory consent checkbox was added, but this is a necessary trade-off for compliance.
Review GDPR consent form examples for proper implementation patterns. Organizations must obtain explicit consent from users before placing cookies that collect personal data on their devices.
How to Integrate Exit-Intent Forms With Email Marketing
Captured leads need nurturing. Integration connects popup submissions to automated workflows.
CRM and Email Platform Connections
Direct integrations eliminate manual data transfer.
Common integration targets:
- Mailchimp
- Klaviyo
- ActiveCampaign
- ConvertKit
- Constant Contact
- HubSpot
Most popup tools offer native integrations with major platforms. Zapier fills gaps for less common tools.
Configure WordPress email settings correctly to ensure delivery of welcome sequences and follow-up messages.
Automated Welcome Sequences
New subscribers should receive immediate follow-up. Not next week. Now.
According to Mailmodo research, automated welcome emails achieve an 80% average open rate and 26% click-through rate. GetResponse data shows welcome emails have an impressive average open rate of 83.63%, making them the highest-performing email type.
Research from Omnisend shows automated emails drive 37% of all email-generated sales despite accounting for just 2% of email volume. Automated campaigns generate 320% more revenue than non-automated emails, according to email marketing automation data.
Effective welcome sequence structure:
- Immediate: Deliver promised offer (discount code, lead magnet)
- Day 1-2: Introduction to brand and key products/content
- Day 3-5: Social proof and testimonials
- Day 7: Next-step CTA (purchase, demo, deeper content)
The popup captured attention. The email sequence builds relationship and drives conversion. Data from Omnisend shows automated welcome emails in ecommerce had a conversion rate of nearly 3% in 2024, while 48% of marketers plan to include email automation in their email programs according to Ascend2 statistics.
Segmentation Based on Popup Source
Not all popup subscribers are equal. Segment them by capture context.
Research shows segmented email campaigns drive 30% more opens and 50% more click-throughs than non-segmented campaigns according to Mailchimp data. Statistics indicate that 90% of email marketing professionals report using subscriber segmentation to deliver targeted messages increases performance.
Useful segments:
- Blog readers: Content interest, nurture longer
- Product page exits: High intent, accelerate offers
- Cart abandoners: Hottest leads, priority follow-up
- Pricing page visitors: Qualification needed
Different segments deserve different sequence content and pacing. A MoEngage study analyzing 5.3 billion emails shows segmented campaigns cause significant improvements across all metrics, ranging from 4X improvement in unique click-through rates and conversion rates to a 26% increase in click-to-open rates.
Someone who abandoned a $500 cart needs aggressive recovery messaging. Someone who downloaded a blog ebook needs educational nurturing. According to DMA research, 25% of revenue share comes from a segmented list of emails, and sending targeted emails to these segments brings 30% of revenue.
Lead Magnet Delivery Automation
Gated content promised in popups must deliver instantly.
Nearly one-third of email recipients who open automated emails make a purchase, according to Omnisend data. Automated emails achieve an average open rate of 42.1%, a 5.4% click rate, and a 1.9% conversion rate.
Configure automation to:
- Send download links immediately on form submission
- Deliver access credentials for member content
- Provide discount codes without delay
- Trigger follow-up sequences after delivery
Delayed delivery frustrates new subscribers and damages trust before the relationship begins. Research shows 47% of organizations use automation to send welcome emails, making it one of the most common automation types according to SmartInsights.
Your form submission confirmation message should clearly explain what happens next and set expectations.
Implementation Tracking:
- Test each integration thoroughly before going live
- Monitor delivery rates (average email deliverability is 83% according to 2024 data)
- Track welcome sequence performance weekly
- Adjust timing based on open rate patterns
- Set up alerts for failed automations
FAQ on Exit-Intent Forms
What is an exit-intent form?
An exit-intent form is a popup that appears when visitor behavior signals departure from your website. JavaScript tracking detects mouse movement toward the browser close button or back button press on mobile devices, triggering your lead capture message.
How does exit-intent technology work on mobile devices?
Mobile exit detection uses different signals since there’s no cursor to track. The technology monitors back button presses, rapid upward scrolling, tab switching, and idle time thresholds to predict when visitors intend to leave your page.
What is a good conversion rate for exit-intent popups?
Average popup conversion sits at 4.65% in 2025. Top-performing campaigns reach 19.77%. Cart abandonment exit popups specifically convert at 17.12% on average, making them among the highest-converting types of popups available.
Do exit-intent popups hurt SEO rankings?
Google penalizes intrusive mobile interstitials that block content. Desktop popups face fewer restrictions. Include visible close buttons, avoid full-screen mobile overlays, and follow Google’s interstitial guidelines to maintain search rankings while capturing leads.
What should I offer in an exit-intent popup?
Discount codes, free shipping, and lead magnets convert best. Match offers to page context. Product pages benefit from percentage-off codes. Blog content works better with downloadable resources or newsletter subscription forms.
How many form fields should an exit-intent popup have?
Single-field forms convert dramatically better. Studies show 120%+ improvement when reducing fields. Visitors have already decided to leave, so minimize friction. Capture email only, then gather additional information through follow-up sequences.
When is the best time to trigger an exit-intent popup?
Let visitors engage before triggering. Popups on second page view hit 28.98% CVR. Avoid immediate triggers on page load. For blog content, wait 30-60 seconds. Checkout pages can trigger on exit intent without delay.
Can I use exit-intent popups on Shopify or WordPress?
Yes. Shopify integrates with OptiMonk, Privy, and similar tools through its app store. WordPress supports exit intent popup plugins including OptinMonster, Sumo, and various free WordPress form plugins with popup functionality.
How do I prevent showing popups to returning visitors?
Use cookie-based frequency capping. Set maximum one popup per 24-hour period. Exclude visitors who already converted. Your popup software should allow targeting rules that skip subscribers or recent purchasers automatically.
Are exit-intent popups GDPR compliant?
They can be with proper implementation. Include clear privacy policy links, explicit consent checkboxes where required, and easy dismissal options. Building compliant forms protects your business legally while increasing form conversions through visitor trust.
Conclusion
Exit-intent forms turn departing visitors into captured leads. The technology works across desktop and mobile, detecting cursor movement and behavioral signals to trigger your offer at the right moment.
The data supports implementation. Popup conversion rates averaging 4.65% in 2025, with top performers hitting nearly 20%.
Success depends on execution. Single form fields reduce friction. Countdown timers create urgency. URL-based targeting improves relevance by 152%.
Test your headline copy. A/B test offer types. Track downstream lead quality, not just submission volume.
Integrate with Klaviyo, Mailchimp, or ActiveCampaign for automated follow-up sequences. The popup captures attention. Your email nurturing converts it.
Start with one high-traffic page. Measure results. Scale what works.
