


Your login form is the first real interaction users have with your product. Get it wrong and they bounce. Get it right and they barely notice it exists. These examples…
Table of contents
Your form gets 1,000 views but only 47 conversions. The other 953 visitors just disappeared.
That’s not a traffic problem. It’s a form optimization problem.
Every abandoned field, confusing label, and slow-loading page costs you leads. The average form conversion rate hovers around 5-10%, but the best-performing forms hit 40% or higher.
This guide shows you how to increase form conversions through field reduction, validation strategies, trust elements, and mobile optimization. You’ll learn exactly which friction points kill submissions and how to fix them.
Stop losing leads to preventable mistakes.
What is a Form Conversion Rate?
Form conversion rate is the percentage of visitors who complete and submit your form compared to total viewers.
If 100 people see your contact form and 15 submit it, you’ve got a 15% conversion rate.
Why Form Conversions Drop
Cognitive Load Issues
Too many fields kill conversions. Zuko Analytics data shows only 38% of users who interact with contact forms actually submit them. Factor in total visitors and conversion drops to 9%.
CXL research proves inline form-field validation reduces errors by 22% and cuts completion time by 42%. Yet most forms still overwhelm users.
Labels that don’t match expectations create confusion. “Phone Number” vs “Mobile” vs “Contact Number” means the same thing, but inconsistency makes people pause and abandon.
Real-time form validation prevents hidden errors that frustrate users who think they’re done.
Trust Barriers
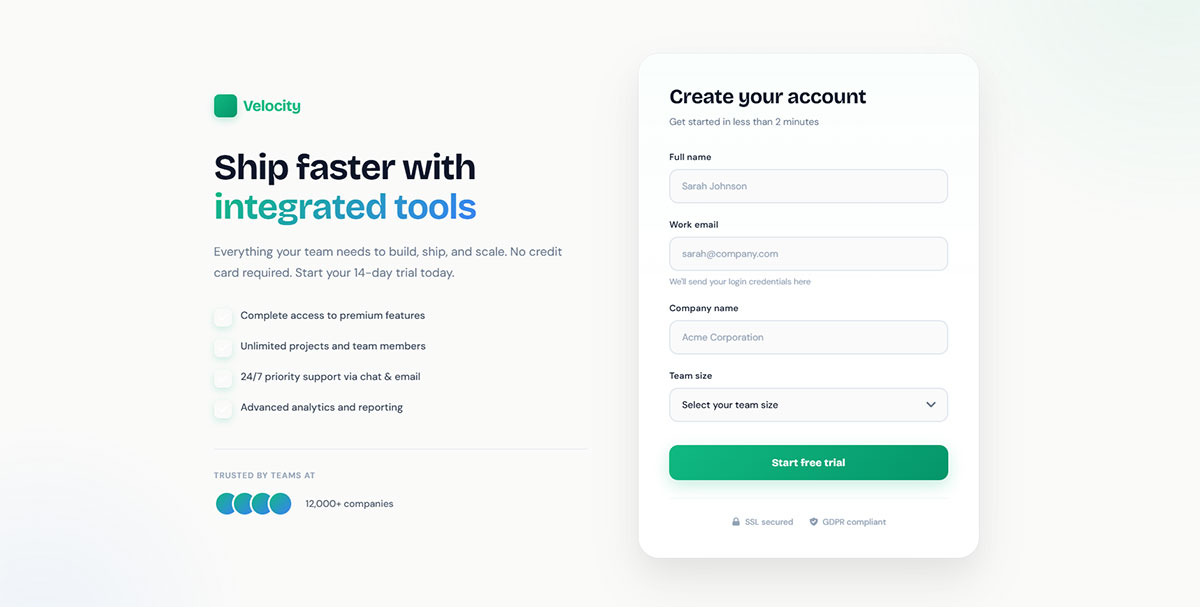
IBM’s 2025 Cost of a Data Breach Report shows breaches cost $4.44 million globally ($10.22 million for U.S. companies). Users know security matters and bounce without SSL certificates.
GDPR compliant forms convert 30% better in European markets. Privacy statements aren’t optional anymore.
Specific trust badges (Norton, McAfee, industry certifications) work. Generic brand presence doesn’t.
Technical Friction Points
Forms taking over 3 seconds to load lose 40% of submissions according to Zuko Analytics. Checkout forms average 3 minutes 21 seconds to complete.
Touch targets under 44×44 pixels cause mobile misclicks and abandonment (Apple HIG and W3C WCAG standards). Mobile forms break more than desktop versions.
Autofill increases conversions by 10%+ per Zuko Analytics. WordPress forms need proper HTML attributes for browser autofill to work.
Free Form Conversion Rate Calculator
Form Field Optimization
Field Count Reduction
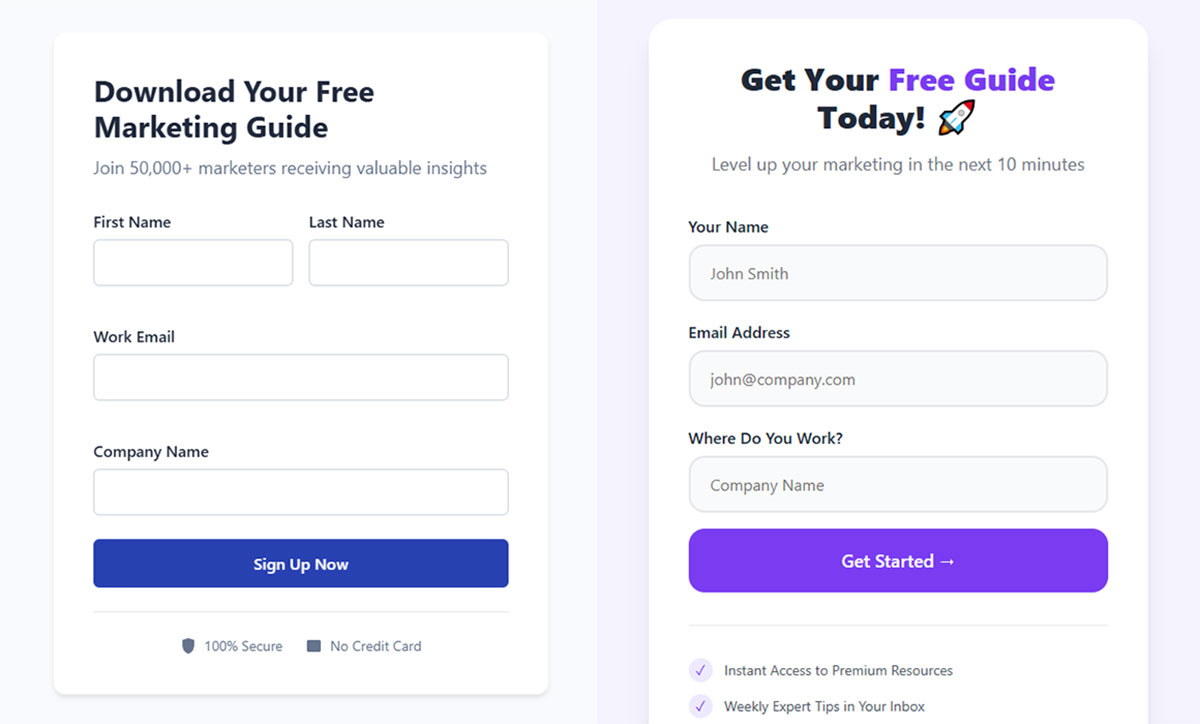
Remove every non-critical field. Marketing wants 15 data points but conversions demand 5 or fewer.
HubSpot data shows 30% of marketers get highest conversion rates from 4-field forms. Average form has 5 fields but reducing from 4 to 3 can boost conversions by 50% according to Quicksprout.
Birthday fields on newsletter signups? Delete them. Progressive profiling collects data across multiple interactions instead of overwhelming users upfront.
Multi-step forms work because they psychologically commit users before asking sensitive information. HubSpot found only 40% of marketers use multi-step forms, yet they see 86% higher conversion rates.
Input Design Best Practices
Top-aligned labels scan 50% faster than left-aligned according to usability research. Placeholder text shouldn’t replace labels because screen readers miss them and they disappear on focus.
Real-time validation shows success states immediately. Green checkmarks after each correct field boost confidence. Baymard Institute research shows 31% of sites lack inline validation, creating unnecessary friction.
Error messages need specificity:
- Bad: “Invalid email”
- Good: “Missing @ symbol”
CXL research shows users complete single-column forms 15.4 seconds faster than multi-column forms.
Field Type Selection
Dropdowns hide options and require extra clicks. Use radio buttons for under 5 choices, dropdowns for 6+.
Text inputs for names beat dropdowns every time. Typing “Michael” is faster than scrolling through 500 names.
Date pickers prevent format confusion. “MM/DD/YYYY” vs “DD/MM/YYYY” causes international headaches.
CXL data shows forms with radio buttons complete 2.5 seconds faster than forms with dropdown selection fields. Baymard found 88% of checkout forms don’t include a single “Name” field, increasing friction unnecessarily.
Phone number patterns vary by country. Auto-detecting region codes based on IP improves mobile completion rates.
Form Layout Strategies
Visual Hierarchy
CXL research: single-column forms complete 15.4 seconds faster than multi-column.
Why? Eyes scan straight down without jumping. Baymard Institute found 16% of sites use multi-column forms, causing users to skip fields or misinterpret requirements.
Key layout rules:
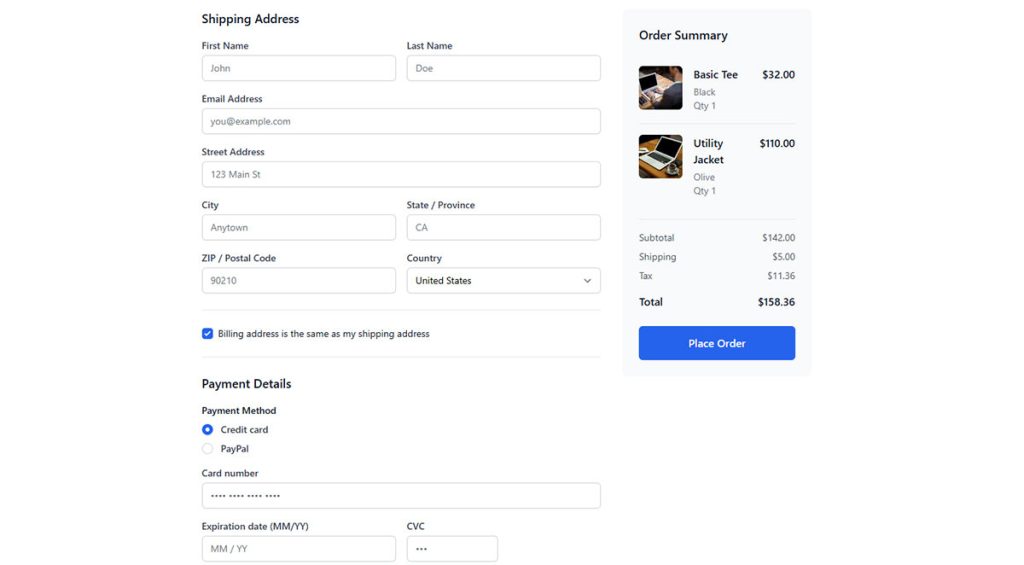
- Group related fields (personal info together, payment together)
- Use white space generously (VWO: buttons with more space convert 200%+ better)
- Make submit button the most dominant element
Step Indicators
Multi-step forms convert 86% higher than single-page (HubSpot). Only 40% of marketers use them.
Must-haves:
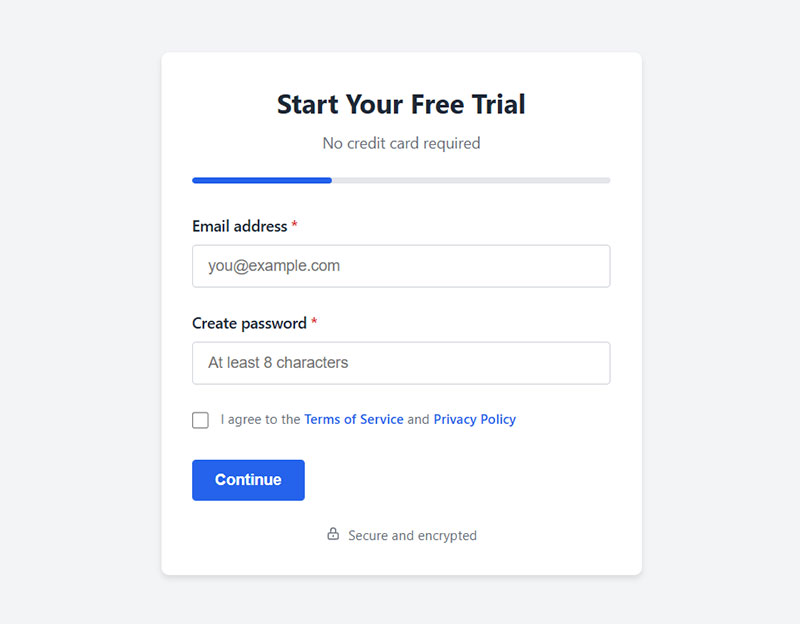
- Progress bar (“Step 2 of 4”)
- Time estimates (“2 minutes remaining”)
- Back button that preserves data
- Save and continue option (email link, no forced account)
Mobile-First Design
Touch targets: minimum 44×44 pixels (Apple/W3C standards). MIT Touch Lab shows average finger width is 45-57 pixels. Anything smaller causes misclicks.
Mobile fixes:
- Input font-size: 16px minimum (prevents iOS zoom)
- Remove sticky headers that push content
- Proper viewport meta tags
- Test all types of forms on actual devices
Trust Elements
Security Signals
IBM 2025 report: data breaches cost $4.44M globally, $10.22M for U.S. companies. Users care about security.
SSL is mandatory. Browsers show “Not secure” without HTTPS, killing trust instantly.
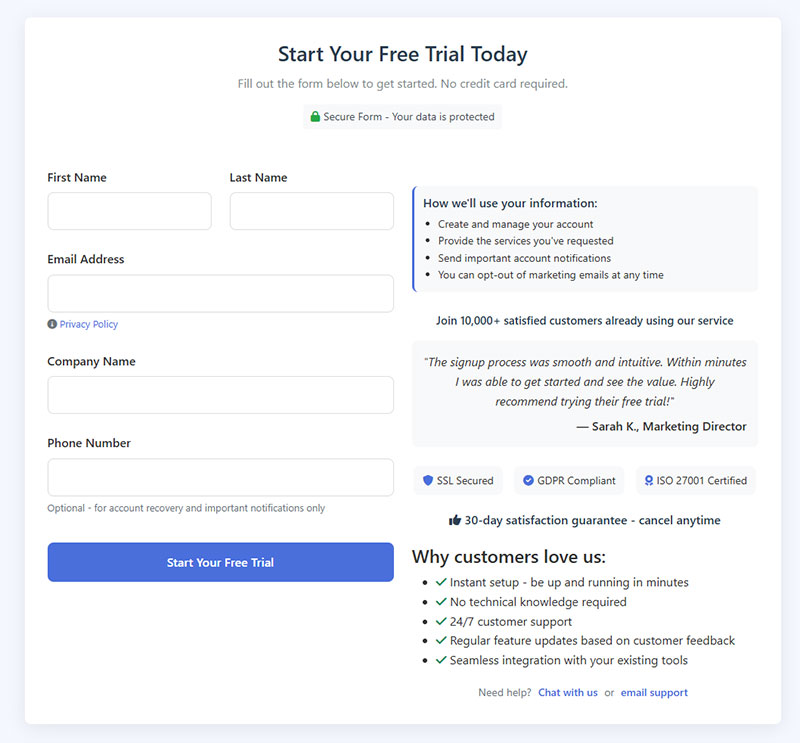
Trust badges boost conversions 42% (Baymard Institute). VeriSign certificates increased hotel booking conversions 30%.
Most trusted brands:
- Norton
- McAfee
- Better Business Bureau
- Industry-specific certifications (HIPAA, PCI DSS, SOC 2)
Add encryption copy: “Your data is encrypted with 256-bit SSL”
Form security matters more than ever.
Privacy Assurances
Keep it simple: “We’ll email you weekly tips and never sell your information”
Requirements:
- Explicit no-spam promise
- One-click unsubscribe mention
- Unchecked consent boxes (pre-checked violates GDPR)
- Clear opt-in explanation before submit
Social Proof
Tuff Growth case study: adding social proof increased homepage conversions 111.8% (5.59% to 11.84%).
Testimonials boost sales page conversions 34%. PowerReviews found products with 5+ reviews are 270% more likely to sell.
What works:
- Real testimonials with names and photos near forms
- Customer count (“Join 47,293 subscribers”)
- Company logos (if Amazon trusts you, prospects will)
- Review ratings (TrustPilot, Google, G2)
Stats that matter: TrustPulse shows 97% of consumers read reviews before buying. BrightLocal found 82% check local business reviews, 88% trust user reviews as much as personal recommendations.
Submit Button Optimization
Button Copy
Action words outperform generic text. WordStream found action verbs like “get,” “reserve,” and “try” beat “submit” or “enter.”
WiserNotify research: action-oriented language increases conversions 121% over passive alternatives. PartnerStack boosted conversions 111.55% (6.66% to 14.09%) by changing “Book a Demo” to “Get Started.”
First-person phrasing works: “Start My Free Trial” can boost clicks 90% according to Sender research.
Value proposition examples:
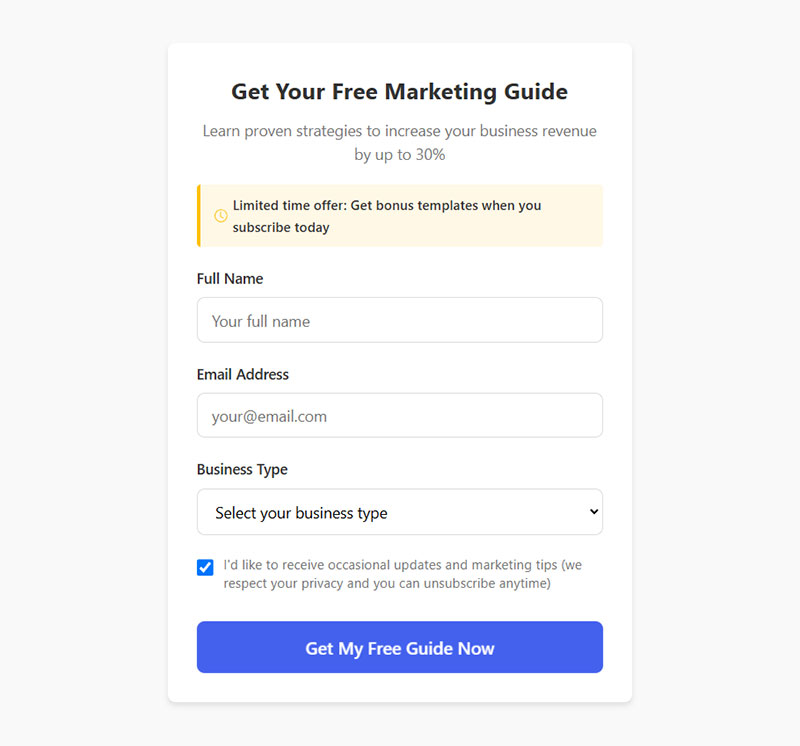
- “Get My Free Guide” (tells exact outcome)
- “Start Saving Money” beats “Sign Up”
- “Claim Your Spot” (authentic urgency)
Visual Design
Button size matters. CampaignMonitor: CTA buttons have 28% higher click-through vs text links. Copyblogger found buttons lead to 45% boost in clicks.
White space increases conversions 200%+ per VWO. Isolated buttons with space around them draw attention better than hyperlinks ever could.
Color contrast converts. QuickSprout found red CTAs increased rates 21%. Contrasting colors to rest of page boost conversions 38% according to CRO statistics research.
Loading states prevent duplicate submissions. Spinner icons or “Processing…” keep users informed.
Success feedback completes the loop. Form submission confirmation messages reduce anxiety and support tickets.
Validation and Error Handling
Inline Validation
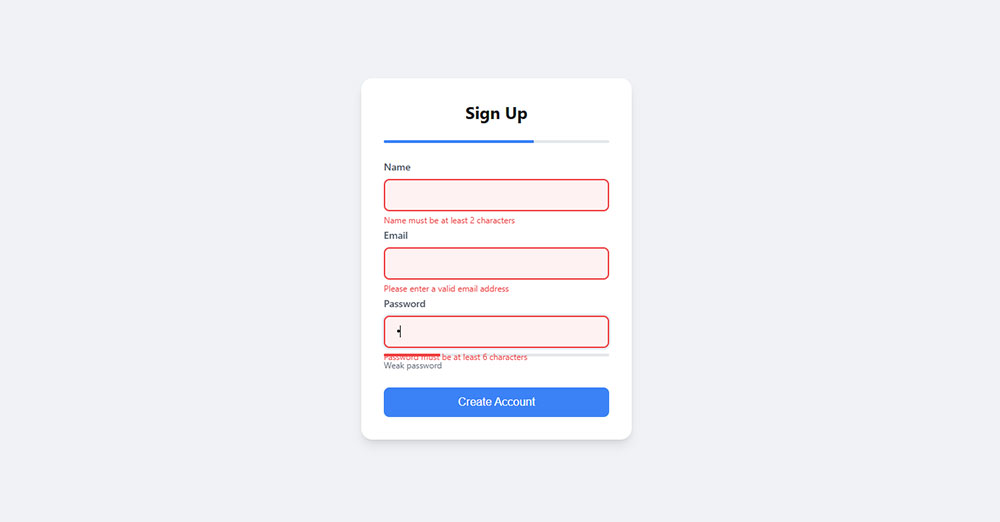
CXL research: inline validation cuts errors 22% and completion time 42%. Yet Baymard Institute found 31% of sites don’t provide it.
Real-time checking catches mistakes immediately:
- Password strength meters guide to acceptable inputs
- Email format validation before next field
- Green borders/checkmarks create positive momentum
- Format helpers (“xxx-xxx-xxxx” under phone fields)
Timing matters. Validate after user leaves field, not while typing. Premature errors frustrate users per Baymard testing.
Web form best practices require smart validation timing.
Error Recovery
Clear messages state problem and solution. “Password must include one number” fixes instantly vs just red highlighting.
Solution guidance prevents repeated failures. “Try adding an uppercase letter” works better than generic error text.
Field highlighting with scroll-to-error on landing page forms prevents users missing problems.
Preserving entered data is mandatory. Users who lose progress after error rarely try again.
Page Speed Impact
Loading Performance
Speed kills conversions. Portent research: sites loading in 1 second have conversion rates 3x higher than sites loading in 5 seconds (for B2B).
Critical thresholds:
- Pages loading in 2.4 seconds: 1.9% conversion rate
- Pages loading in 3.3 seconds: 0.9% conversion rate
- Pages loading in 5.7 seconds: 0.6% conversion rate
Each second costs 7% in conversions. Walmart found every 1 second improvement increased conversion rate 2%.
Mobile delay impact: 20% conversion drop for each second delay. 53% of mobile visitors leave if page takes over 3 seconds.
Optimization Tactics
Form script size affects bounce. Every 100KB adds 0.5 seconds on 3G connections.
Image optimization crucial:
- Compress trust badges/logos under 50KB each
- Use WebP format (better compression than JPEG/PNG)
- Lazy load images below fold
Third-party scripts slow everything. Google Analytics, heatmaps, chatbots add 2-3 seconds combined. Load critical CSS inline, defer rest.
Interaction Timing
Input response under 100ms feels instant. Delays feel sluggish and broken.
Validation speed matters on every keystroke. Debounce API calls (check email uniqueness without overloading server).
Submit processing needs perceived speed:
- Show confirmation instantly
- Process data in background
- Users click multiple times if nothing happens within 2 seconds
Autofill and Pre-population
Browser Autofill
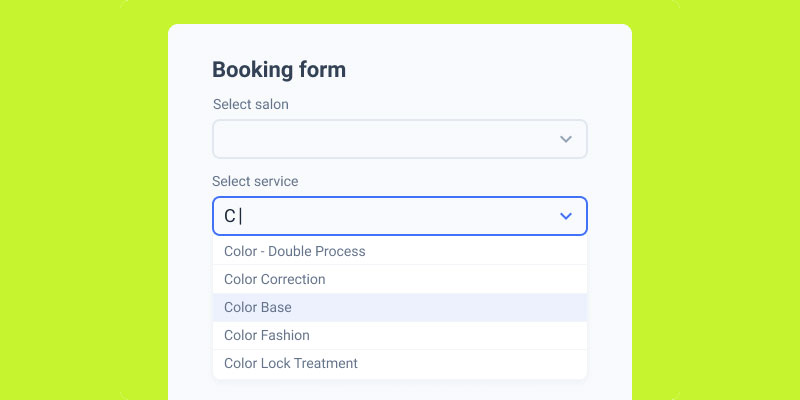
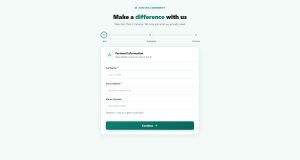
Image source: JetFormBuilder
Zuko Analytics research: autofill increases conversion rates 10%+. Users who triggered autofill had 71% completion rate vs 59% for non-users (23% of users triggered autofill).
Google data shows users complete forms 30% faster with autofill enabled. PayKickstart clients saw conversion increases up to 30% using auto-address features.
Implementation requirements:
- Proper name attributes (
autocomplete="email"fills instantly) autocomplete="off"forces manual typing (avoid this)- Follow HTML standards (“given-name” for first, “family-name” for last)
- Consistent naming (browsers guess from id, name, label text)
Mobile wallet support speeds checkout. Apple Pay and Google Pay require specific input attributes on WordPress payment forms.
Smart Defaults
Location detection fills country/state. IP-based geolocation pre-selects options automatically.
Previous selections from cookies personalize repeat visits. Returning users see last choices pre-selected.
Reduce decision fatigue:
- Default radio button to most popular option
- B2B forms default to business email domains
- B2C defaults to personal addresses
CTA Positioning
Above the Fold
Nielsen Norman Group: forms placed above fold capture 57% of page-viewing time.
Placement matters—high-performing sites always embed forms strategically across key pages. Primary placement captures attention immediately. Users engage more with visible forms on landing page forms.
Timing strategies:
- Scroll trigger after 30 seconds or 50% depth
- Sticky “Get Started” buttons maintain visibility
- Exit intent popups catch abandoners (mouse toward browser close)
HubSpot data: popups make up 66% of signup forms, but landing pages have best signup rates at 23%. Static forms perform better than modal popups (45.53% vs 25.96% success rate per Factors.ai).
In-content Forms
Contextual placement converts when timing matches intent. Product descriptions end with “Request Demo” forms naturally.
Flow integration feels organic:
- Blog posts about problems lead into solution signups
- Hide navigation/sidebars/footers on dedicated lead capture forms
- Related content links provide escape valves for users not ready to convert
A/B Testing Methods
Test Variables
Field combinations change conversion rates dramatically. Testing 5 vs 3 fields often yields 40% swings.
HubSpot: marketers running A/B tests report conversion rates 10% higher than those who don’t optimize forms. A/B testing CTAs can result in 49% improvement in click-through rates.
Priority tests:
- Label wording (“Email Address” vs “Work Email” filters audience quality)
- Button colors (financial services vs e-commerce audiences respond differently)
- Layout variations (desktop vs mobile performance gaps)
Measurement Framework
Conversion tracking needs proper setup. Google Analytics 4 tracks form_submit events by default if configured correctly.
Analysis tools:
- Drop-off analysis identifies friction points (Hotjar shows which field causes abandonment)
- Time to complete reveals complexity (forms over 3 minutes need simplification)
- Field interaction data exposes confusion (clicked but left empty = unclear requirements)
Statistical Significance
Sample size varies by traffic:
- Low-traffic sites: 4-6 weeks minimum
- High-traffic sites: results in days
- B2B forms: test full week (weekday vs weekend behavior)
Requirements:
- 95% confidence minimum (below this is unreliable noise)
- Secondary metrics matter (conversion up but lead quality down isn’t success)
- Full business cycle testing (don’t stop tests mid-week)
Analytics Setup
Event Tracking
Form impressions count actual views. Users who never see your form can’t convert.
Field focus events track engagement. Zuko research shows password fields have highest abandonment (10.5%), followed by email (6.4%) and phone (6.3%).
Abandonment points reveal problem fields. 60% drop-off at phone number signals trust or relevance issues.
Average form abandonment time: 1 minute 43 seconds per Feathery data. Compare your completion time against industry benchmarks.
Funnel Analysis
Step progression shows multi-step performance on registration forms.
Drop-off identification priorities:
- Fix biggest leak first
- Segment comparison (mobile users abandon 40% more than desktop per stats)
- Device performance (iOS vs Android error patterns differ)
Zuko data: 23% trigger autofill, with 71% completion rate vs 59% for non-users.
Key Metrics to Track
- View-to-starter rate (how many click first field)
- Starter-to-completion rate (begun vs finished)
- Field return rate (users going back to change answers)
- Time to complete vs industry average
- Device-specific conversion rates
Recovery Tactics
Abandonment Emails
Dynamic Yield research: 44.1% of abandoned cart emails get opened, nearly a third of clicks lead to recovered sales.
Formsort data shows 20% of partial form responders complete when sent a recovery link.
Timing matters:
- Send 30 minutes after abandonment (catches users while they remember)
- Klaviyo 2024: abandoned cart emails have 50.5% open rate (27% higher than average ecommerce emails)
- First email in series: 62.94% open rate (best performing)
Message structure:
- Reference partial progress (“You were almost done with your quote”)
- Include incentive (10% off, free shipping tips fence-sitters)
- Pre-fill saved data via return link
- Multiple email series perform best (3 emails generate $24.9M vs $3.8M for single email per Klaviyo)
Email Performance Benchmarks
Open rates by email count:
- Single email: 62.94%
- Two-email series: 48.65%
- Three-email series: 46.11%
Click rates:
- One email: 14.53%
- Two emails: 11.83%
- Three emails: 10.69%
Sender data: cart abandonment emails with coupons see 44.37% open rate, 10.85% click-through.
Retargeting
Pixel placement tracks form viewers. Facebook and Google pixels identify who saw but didn’t submit.
Audience segmentation focuses spend:
- Target form abandoners differently than never-viewers
- Mobile abandoners need different messaging
- Desktop users have 70% cart abandonment vs 80.2% mobile
Ad messaging strategy:
- Remind of benefits (“Still interested in reducing energy bills?”)
- Link directly to abandoned form (not homepage)
- Maintain context from original visit
Recovery Best Practices
67% of users abandon forever if they hit complications (only 20% follow up). Make recovery seamless:
- Send first email within 1 hour (16% conversion rate per research)
- Use 3-email series for maximum revenue recovery
- Pre-populate saved data automatically
- Add trust badges to recovery landing pages
- Mobile-optimize recovery experience (80% of mobile users abandon)
Industry abandonment rates to benchmark against:
- Travel: 81% (highest)
- Nonprofit: 77.9%
- Finance: 75.7%
- Retail: 75.8%
- Average across all: 70-77%
FAQ on How To Increase Form Conversions
What is a good form conversion rate?
Industry benchmarks vary widely, but 5-10% is average. High-performing forms with proper optimization reach 20-40% conversion rates.
B2B lead generation forms typically convert lower than B2C subscription forms due to longer consideration cycles.
How many form fields should I use?
Three to five fields maximize conversions for most use cases. Each additional field reduces completion rates by 10-20%.
Ask only what you absolutely need now. Progressive profiling collects additional data later through follow-up interactions or behavioral tracking.
Should I use single-step or multi-step forms?
Multi-step forms convert 10-15% better for complex requests requiring 6+ fields. Single-step works best for simple actions like newsletter signups.
Breaking long forms into logical steps reduces cognitive load and creates commitment through incremental progress.
How do I reduce form abandonment rate?
Remove unnecessary fields, add real-time validation, improve page speed, and display trust signals. Form abandonment averages 67% across industries.
Exit-intent forms can recover 10-15% of abandoners with compelling last-chance offers or simplified alternatives.
Do trust badges really increase form conversions?
Yes, but only recognizable ones. SSL certificates, Norton, McAfee, or industry certifications boost conversions 15-30%.
Generic “secure checkout” images without verification add zero value. Users trust third-party validation over your own security claims.
What’s the best submit button text?
Action-oriented, benefit-focused copy outperforms generic “Submit” by 20-40%. “Get My Free Guide” or “Start Saving” tells users what happens next.
First-person language increases clicks. “Get My Report” converts better than “Get Your Report” because it creates personal ownership.
How does mobile optimization affect form conversions?
Mobile accounts for 60%+ of form traffic but converts 40% lower than desktop without optimization. Touch targets under 44×44 pixels cause errors.
Proper autocomplete attributes, 16px minimum font size, and single-column layouts dramatically improve mobile form performance.
Should forms use placeholder text or labels?
Always use visible labels above fields. Placeholder text disappears on focus, confusing users mid-completion and failing accessibility standards.
Placeholders work as format examples under labels, like “[email protected]” for email fields, but never as label replacements.
How long should users wait for form submission?
Users expect instant feedback within 2 seconds. Longer delays cause duplicate submissions or abandonment.
Show immediate confirmation with a success message or redirect, then process data in the background for complex operations.
What’s the impact of page speed on form conversions?
Forms loading in under 2 seconds convert 3x better than those taking 5+ seconds. Every additional second reduces conversions by 7%.
Optimize form scripts, compress images, defer non-critical JavaScript, and use lazy loading for elements below the fold.
Conclusion
Learning how to increase form conversions transforms website visitors into qualified leads. Every field removed, error message clarified, and trust signal added compounds your results.
Start with the biggest wins: reduce field count, implement inline validation, and fix mobile layout breaks. These changes alone typically boost conversion rates 20-30%.
Then layer in A/B testing for button colors, CTA copy, and form placement. Small improvements across multiple elements create dramatic cumulative gains.
Your analytics reveal exactly where users abandon. Focus optimization efforts on those specific friction points rather than guessing.
The forms that convert best combine psychology, technical performance, and user experience. Master all three dimensions.