
Most lead magnets don’t work. They get downloaded, skimmed for 30 seconds, and forgotten. Meanwhile, your email list fills up with people who will never buy anything. The problem isn’t…
Table of Contents
Your website gets traffic, but your calendar stays empty.
Lead generation for travel companies isn’t about attracting more visitors. It’s about converting browsers into bookers.
Most travel businesses waste money on marketing that generates interest but zero bookings. They post beautiful destination photos, run ads, and publish blog posts, yet inquiries never turn into revenue.
The difference between struggling and thriving comes down to systematic lead capture and nurture processes. You need specific tactics that work for the travel industry’s unique buying cycles, high price points, and emotional decision-making.
This guide covers proven methods that actually generate qualified leads and convert them into paying customers. From website optimization and content strategy to paid advertising and partnership programs, you’ll learn what works now in travel marketing.
No theory. Just practical tactics you can implement this week.
Understanding Travel Lead Generation Fundamentals
Travel decisions take time. Research from Navan shows travelers consume 303 minutes of content in the 45 days before booking. This extended cycle changes everything about customer acquisition.
What Makes Travel Leads Different
Price dominates. Travelers compare options across multiple tabs before committing. According to iSeatz’s 2024 research, Millennials and Gen Z use comparison shopping sites extensively, then turn to OTAs and direct suppliers to finalize bookings.
They’re not just hunting for deals. Trust matters when someone hands over vacation money. Emotional triggers drive decisions differently depending on the trip type (honeymoon vs. family spring break vs. business conference).
Buying behavior shifts based on trip type, traveler experience, and planning timeline.
Longer Decision Cycles vs. Other Industries
E-commerce converts in days. Travel? That’s different.
Data from Navan shows business travelers now book flights 6.2 days earlier than pre-pandemic. For leisure travel, Booking.com’s 2025 research found travelers plan trips well in advance, with research cycles extending weeks or months.
You need systems that nurture prospects for extended periods. Someone who downloads your Paris guide in January won’t book until March.
Email nurturing becomes critical when decision cycles stretch across months, not hours.
Price Sensitivity and Comparison Shopping Behavior
Every traveler has TripAdvisor, Kayak, and Google Travel open. Accept this.
Your job isn’t preventing comparison shopping (impossible). Make your value so clear that price becomes one factor among many.
According to Promodo’s 2024 benchmarks:
- Travel website conversion rates range from 0.2% to 4%
- Top 20% of sites convert above 2%
- Elite performers hit 3-4% conversion
Trust signals, unique experiences, and customer service justify premium pricing. Flash sales work because they create urgency. Limited availability messaging works because it’s often true.
Types of Travel Leads Worth Pursuing
Not all inquiries deserve equal attention. Qualify fast.
Ready-to-Book vs. Research-Phase Travelers
Ready-to-book leads ask about specific dates, exact package pricing, or tour availability. These need immediate personal attention.
Research-phase travelers ask broad questions (“best time to visit Thailand?”). They’re gathering information.
According to Ruler Analytics’ 2024 data, travel conversion rates vary significantly by channel:
- Email: 2.6% average conversion
- Form submissions have higher intent than general website traffic
- Phone inquiries signal stronger buying intent
Route each type differently. Ready-to-book leads get immediate response with clear CTAs. Research-phase contacts enter nurture sequences.
Individual Travelers vs. Group Bookings
Group bookings mean higher revenue but longer cycles. Sabre’s 2024 data shows 14% increase in 7-person bookings and 23% growth in groups of 8+.
Corporate travel and incentive programs have multiple decision-makers. Individual travelers book faster with lower transaction values.
According to Booking.com for Business, companies spend:
- $1,771 per trip for non-senior business travelers
- $1,986 per trip for senior decision-makers
- Large companies average $2,095 vs. small/medium businesses at $1,549-$1,783
Your lead generation form should identify group size early to route inquiries properly.
Business Travel Leads
Business travelers bring recurring revenue. Research from Perk shows 87% of employees believe in-person meetings drive company growth. Deloitte’s 2024 study found over 60% of business travelers expect to attend conferences or trade shows.
The Global Business Travel Association reports corporate travel spending hit $1.48 trillion in 2024, projected to reach $2 trillion by 2028.
These leads need different messaging:
- Time savings over adventure
- Reliability over romance
- Expense reporting simplicity
Landing one corporate client fills hotel rooms or tour slots for months.
Lead Quality Over Quantity
Getting 1,000 emails sounds impressive until 900 never book.
Defining Qualified Leads for Your Specific Niche
Luxury safari operators and budget tour companies define “qualified” differently.
Write down your ideal customer profile:
- Preferred destinations
- Typical budget range
- Booking lead time
- Group size patterns
Use these criteria to score incoming leads. Not everyone who fills a form deserves immediate sales attention.
Track qualification criteria that predict actual bookings, not vanity metrics.
Cost Per Lead vs. Cost Per Booking Metrics
Cheap leads that don’t convert waste more money than expensive leads that book consistently.
Industry benchmarks from Unbounce show travel landing pages convert at 4.8% median. According to research compiled by Causal Funnel:
- Client referrals: 25% conversion rate
- Website inquiries: 12% conversion rate
- Travel show leads: 8% conversion rate
A $50 lead booking at 30% beats a $10 lead with 2% conversion.
Optimize for cost per booking, not cost per lead. Most companies focus too much on volume, not enough on conversion.
Your Website as a Lead Generation Machine
Your website works 24/7. It should capture leads while you sleep.
Statista reports that desktop visitors convert at 7.6% while mobile converts at only 2.6% for travel sites. Most sites waste both traffic sources.
Homepage Design That Converts Visitors
First impressions happen in seconds.
Above-the-Fold Lead Capture Opportunities
Your homepage top needs clear value and immediate engagement options. Not everyone books now, but everyone should take action.
Email capture works. Quiz forms like “Find Your Perfect Destination” work better.
Speed matters: Promodo’s 2024 benchmarks show sites loading in 1 second convert 2.5x higher than 5-second sites. The top 20% of travel sites convert above 2%. Elite performers hit 3-4%.
Put phone numbers and live chat in the header. Don’t hide contact info.
Trust Signals That Matter to Travelers
49% of consumers see missing trust badges as fraud indicators (TrustedSite).
Use real testimonials with photos. Video testimonials perform best.
Blue Fountain Media found trust badges increased form conversions by 42%. Verisign certificates drove 30% higher conversions for hotel bookings.
Display industry credentials above the fold:
- Virtuoso membership
- ASTA accreditation
- BBB rating
- Customer review counts
Clear Value Propositions Without Marketing Fluff
Bad: “We create unforgettable journeys” Good: “Custom Italy tours with local guides and skip-the-line access”
Specificity wins. Lead with your unique angle.
Landing Pages That Actually Get Bookings
Generic pages get generic results. Destination-specific pages match search intent and convert.
Single-Purpose Pages vs. Cluttered Layouts
One page. One goal.
Sign up for newsletter. Download destination guide. Request quote. Pick one.
Unbounce data: paid social converts 3x worse than paid search for travel. Email and paid search capture high-intent visitors.
Multiple CTAs confuse. Remove navigation menus from high-intent pages. Every exit reduces conversions.
Destination-Specific Landing Pages
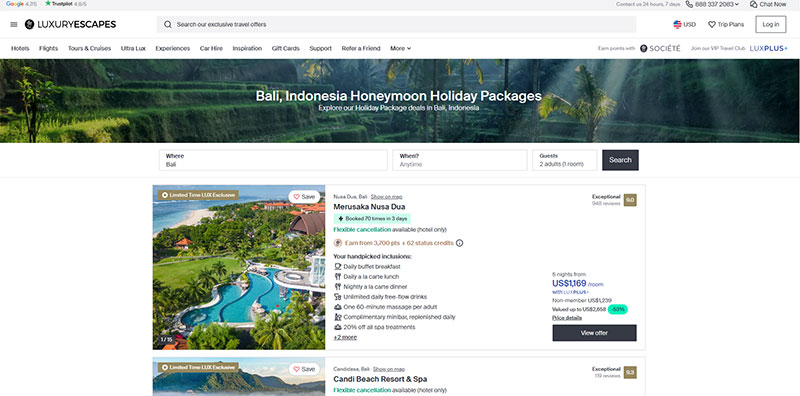
Someone searching “Bali honeymoon packages” needs a Bali honeymoon page. Not your homepage.
Create separate pages for top destinations and trip types. Include local images, specific itineraries, pricing.
The mobile reality: Promodo reports 60% of travel traffic comes from mobile. Desktop users browse 6 minutes 59 seconds vs. mobile’s 3 minutes 30 seconds.
Package Deal Landing Pages
Package deals simplify decisions. Show complete options instead of forcing DIY trip building.
Highlight what’s included, what’s not, why this makes sense.
Landing page forms should be short: name, email, maybe phone. Get details later.
Forms That People Actually Fill Out
Long forms kill conversions.
Zuko research: 66% of users complete forms after starting, but asking too much upfront stops them from beginning.
Progressive Profiling Techniques
Ask basic info first: name and email. Collect details through later interactions.
Your CRM should track existing info. Never ask twice.
This increases initial completions while building complete profiles eventually.
How Many Fields Is Too Many
Top-of-funnel lead magnets: 2-3 fields maximum.
WPForms data shows removing a single field boosts completion by 25%.
Booking requests: 8-10 questions work. People ready for quotes will answer more.
Critical insight: Zuko Analytics found phone fields decrease conversion by 5% unless optional. Making phone optional increases capture rates by 275%.
Multi-Step Forms vs. Single-Page Forms
Multi-step forms make long forms feel shorter. “Step 1 of 3” feels manageable.
Hubspot: multi-step forms convert 86% higher than single-page.
Downside: some abandon between steps. Use progress indicators and easy back-editing.
Single-page forms work better for mobile. Fewer technical issues.
Mobile Form Optimization
60% of traffic is mobile (Promodo). If forms don’t work on phones, you’re losing half your leads.
CXL research: inline form validation reduces errors by 22% and decreases completion time by 42%.
Use thumb-friendly buttons. Trigger the right keyboard (numeric for phone, email keyboard for addresses).
Test on actual devices. Real-world testing catches what desktop testing misses.
Live Chat and Chatbots Done Right
Chat can capture leads or annoy visitors. Implementation matters.
23% of travel companies use chatbots for inquiries and bookings. Live chat increases conversion rates by 3.87% (Popupsmart).
When Human Chat Beats Bots
Complex trip planning needs human expertise.
AI handles “what are your hours?” but struggles with “help me plan a two-week Mediterranean cruise.”
80% of customers report positive chatbot experiences (Uberall). However, 66% of travelers prefer chatbots for work trips but want humans for complex leisure planning.
High-value leads deserve immediate human attention:
- Luxury travel
- Group bookings
- Multi-destination trips
Use bots for qualification and after-hours. Route qualified leads to humans fast.
Qualifying Questions That Don’t Annoy
“How can I help?” works fine.
Following up with ten questions before answering doesn’t.
Ask 1-2 qualifying questions max before providing value:
- “What type of trip are you planning?”
- “What’s your timeframe?”
37% of travelers prefer chatbots to compare deals for straightforward bookings (Master of Code). Save detailed questions for after you’ve provided help.
Performance data: Chatbots respond 3x faster than humans and handle 69% of full conversations without intervention. 87% of people choose chatbots if it saves time and money.
Content That Attracts Travel Leads
Publishing random posts won’t generate leads. Strategic content targeting travelers at different planning stages will.
According to Peek Pro, 74% of travelers used online platforms to plan trips in 2023. The key is matching content types to decision stages.
Destination Guides That Rank and Convert
Everyone publishes destination guides. Most are worthless for lead generation because they’re too generic.
Going Beyond Generic Travel Advice
Detailed, specific information wins.
“10 Things to Do in Paris” has been written 50,000 times. “Hidden Courtyards in Le Marais: A Local’s Guide” hasn’t.
Your unique angle comes from actual experience. Include practical details: exact costs, specific addresses, booking tips. This depth builds authority.
Redline Digital reports companies with content marketing see 6x higher conversion rates. Businesses that blog experience 165% more lead growth compared to non-blogging companies.
Insider Tips That Build Authority
Share information travelers can’t easily find elsewhere:
- Restaurant recommendations not on every “best of” list
- Lesser-known viewpoints
- Timing tips to avoid crowds
These insider details signal you actually know the destination.
This expertise makes readers trust you with their trip planning.
Adding Booking CTAs Without Being Pushy
Work offers into content naturally. “If you want help planning a custom itinerary for these hidden gems, we can help” doesn’t interrupt flow.
Offer a related lead magnet at guide’s end. A downloadable neighborhood map or restaurant checklist works well.
Don’t put aggressive “BOOK NOW” buttons after every paragraph. It damages reader experience.
Travel Blog Posts That Generate Leads
SEO visibility, trust building, and lead capture all matter.
According to SEO.com, blog posts with at least one video attract 70% more organic traffic than those without.
Problem-Solving Content vs. Promotional Content
Answer actual questions your target customers have. “How to pack for a two-week Europe trip with only a carry-on” solves a real problem.
Problem-solving posts rank better and get shared more. They position you as helpful rather than salesy.
Keep promotional content to 20% of blog output. The other 80% should genuinely help people.
Data from Redline Digital shows 80% of bloggers report blogging drives results. Those publishing 2-6 times weekly are 50% more likely to report strong results.
Personal Experience Posts
First-person trip reports build connection. “I spent three days exploring Kyoto’s temple gardens” feels more authentic than generic descriptions.
Include specific details, photos from actual trips, honest observations (including what didn’t work).
This vulnerability makes your brand relatable and trustworthy.
Comparison Articles
“Costa Rica vs. Panama for Eco-Tourism” helps travelers narrow options while showcasing your knowledge.
Comparison posts capture people early in research. They’re actively deciding, making them qualified leads.
Be fair. Obvious bias ruins credibility.
Visual Content That Stops Scrollers

Text alone doesn’t cut it. Images and videos drive emotional responses that lead to bookings.
User-Generated Content and Testimonials
Photos from actual customers work better than professional stock photography. They’re authentic and provide social proof.
The UGC advantage: CrowdRiff research shows 85% of consumers find UGC more influential than brand photos. 32-39% of millennials won’t book a hotel or experience from brands that don’t use UGC in marketing.
Create a branded hashtag and encourage customers to share experiences. Feature the best on your site and social channels.
Video testimonials where customers discuss their experiences are incredibly persuasive.
According to CrowdRiff, brands featuring UGC on websites can increase time-on-site by up to 90%.
Video Tours and Destination Previews
Short clips help prospects visualize trips. A 60-second walk through a Santorini hotel property does more than twenty paragraphs.
Video performance data:
- 66% of travelers watched videos while planning trips (Google)
- Travel video views on YouTube increased 118% year over year
- 71% of European users likely to book based on TikTok recommendations (KORTX)
YouTube serves as the second-largest search engine. Publishing destination videos brings organic traffic.
Include CTAs and links to booking pages in video descriptions and end screens.
Forge Apollo found that 90% of marketers report positive ROI from video, with 87% saying video increased leads and sales.
Interactive Maps and Tools
Interactive planning tools keep visitors engaged longer and provide value while capturing leads.
Budget calculators for specific destinations help travelers figure out affordability. Trip planning checklists organized by destination show expertise.
These work as gated content (email required) or open resources that build goodwill.
Lead Magnets Travelers Actually Want
Generic “subscribe to our newsletter” isn’t compelling. Offer something specific and immediately useful.
Downloadable Packing Lists
Destination-specific packing lists are simple to create and genuinely helpful. “Ultimate Packing List for Iceland in Winter” has clear value.
These convert well because they’re actionable and save time.
Gate them behind email signup. The value justifies the exchange.
Destination-Specific Guides and Maps
Comprehensive PDF guides work as high-value lead capture forms. Make them substantial (15-20 pages minimum).
Include maps, itineraries, restaurant recommendations, insider tips. This demonstrates expertise while collecting contact information.
Promote these guides in blog posts about the same destinations.
Budget Planning Spreadsheets
Editable spreadsheets help travelers estimate trip costs. Include categories: flights, accommodation, food, activities, transportation.
Pre-populate cells with average costs to make it immediately useful.
These position you as helpful from the start of their planning process.
Exclusive Deals and Early Access
“Join our email list for exclusive last-minute deals” works if you actually send valuable offers.
Early access to new tour dates or limited-availability packages rewards subscribers with genuine value.
Follow through. Sending generic promotional emails after promising exclusive deals destroys trust.
Email Marketing for Travel Companies
Email delivers one of the highest ROIs for travel bookings.
According to EmailTooltester, the travel and tourism industry sees $53 ROI for every $1 spent on email marketing. Direct inbox access means you can nurture from inspiration to booking.
The mistake? Treating email like broadcasting instead of conversation.
Building Your Email List From Scratch
You can’t email people who aren’t on your list. Growing quality subscribers comes first.
Exit-Intent Popups That Work
Someone’s about to leave without taking action. Exit-intent forms detect that moment and offer one last chance.
“Wait! Get our free Bali planning guide before you go” works better than generic newsletter signup.
Timing matters: Immediate popups annoy. Exit-intent waits until they show leaving behavior.
Offer something specific and immediately valuable. Generic “stay updated” messaging converts poorly.
Content Upgrades on Popular Posts
Your most-read blog posts are traffic goldmines. Add relevant content upgrades to convert that traffic.
A post about “Best Time to Visit Japan” should offer a downloadable seasonal guide. European train travel post should offer a rail pass comparison.
Match the upgrade to post topic. Unrelated offers feel spammy and convert poorly.
Refer-a-Friend Programs
Your happy customers know other travelers. Give them a reason to share.
Offer both parties something valuable. “$50 off your next booking when someone you refer makes their first trip” motivates sharing.
Make sharing easy with pre-written messages and simple sharing buttons. Friction kills referrals.
Partnership List-Building
Collaborate with complementary businesses serving your target audience. Hotels partner with tour operators. Destination wedding planners partner with venues.
Co-create valuable content (joint webinars, shared guides) requiring email signup.
Both parties grow lists with qualified, relevant subscribers.
Welcome Sequences That Set the Tone
Your welcome email gets opened more than any other message. Don’t waste it.
According to Omnisend, automated emails drove 37% of all email-generated sales in 2024. Welcome sequences are your first automation opportunity.
First Email Timing and Content
Send your first welcome email immediately. Within minutes, not hours or days.
Thank them for subscribing. Deliver what you promised (guide, checklist, discount code). Set expectations for what comes next.
Include a clear call-to-action beyond “here’s your download.” Ask them to follow Instagram or check popular destinations.
Providing Value Before Asking for Bookings
Your welcome sequence should educate and inspire before trying to sell.
Email 2: travel planning tips Email 3: customer success story Email 4: introduce your services
Build trust first. Booking requests become more effective after establishing credibility.
Segmenting New Subscribers Immediately
Not everyone joining your list has the same interests.
According to Mailchimp data, segmented email campaigns have 14.31% higher open rates than non-segmented ones.
Ask about preferred destination types or travel style during signup. “What type of travel interests you most?” with options like adventure, luxury, family, or budget segments automatically.
Send different welcome sequences to different segments. Luxury travelers and budget backpackers need different messaging.
Nurture Campaigns for Different Travel Stages
Someone researching “best time to visit Thailand” is months away from booking. Someone asking about “availability for Phuket hotels next month” is ready now.
Match email strategy to these stages.
Inspiration Phase Emails
Early-stage contacts need destination ideas and travel inspiration. Beautiful imagery, destination highlights, trip ideas work here.
Don’t push bookings hard. Keep your brand top-of-mind while they figure out where to go.
Share customer trip photos, seasonal destination features, “you might like this” suggestions based on interests.
Research and Planning Phase Content
Now they know where they want to go. They’re comparing options, reading reviews, calculating budgets.
Send practical planning information:
- Visa requirements
- Best neighborhoods
- Estimated costs
- Sample itineraries
Include subtle CTAs. “Need help planning your itinerary? Our specialists can customize everything for you.”
Decision-Making Support Emails
They’re close to booking but haven’t pulled the trigger. Address common objections.
Social proof works here. Customer testimonials, trust badges, “other travelers also loved” suggestions push toward action.
Limited-time offers or availability alerts create urgency without being pushy.
Promotional Emails That Don’t Feel Spammy
Constant sales emails make people unsubscribe. Strategic promotional messages drive significant bookings.
MailerLite 2024 benchmarks show travel industry open rates at 53.21%, among the highest of all industries. But only when you don’t abuse the privilege.
Flash Sales and Limited-Time Offers
24-48 hour flash sales create urgency. “Book any European tour by midnight tomorrow and save 15%” gives a clear deadline.
Make the offer genuinely valuable. Tiny discounts don’t motivate action.
Don’t run flash sales every week. They lose impact when overused.
Last-Minute Deal Announcements
Last-minute inventory needs filling. Travelers with flexible schedules love spontaneous deals.
“Leave for Costa Rica next week and save 30%” targets specific subscribers (flexible travelers who can book quickly).
Send these to engaged subscribers who’ve shown interest in similar destinations.
Seasonal Promotions
Peak season bookings happen months in advance. Promote early-bird pricing to fill your calendar.
“Book your summer Greece trip before February and save” encourages early planning.
Seasonal content (packing tips for winter destinations, summer travel inspiration) keeps promotions relevant rather than salesy.
Exclusive Subscriber Discounts
Reward your email list with deals they can’t get elsewhere. This reinforces subscription value.
“Subscriber-only: Extra night free on any 5+ day booking this month” makes subscribers feel special.
Track redemption rates to see which offers resonate with your audience.
Re-Engagement Campaigns for Cold Leads
Not everyone staying engaged. Re-engagement campaigns win back inactive subscribers.
Send a “we miss you” email to people who haven’t opened anything in 90+ days. Offer something compelling.
If they still don’t engage, remove them. Inactive subscribers hurt deliverability rates.
Selzy research shows the travel industry maintains 98%+ deliverability rates, but only with good list hygiene.
Social Media Lead Generation Tactics
Social media works differently than other channels. Research from WinSavvy shows that 89% of travelers turn to social media for travel inspiration, but they’re not there to shop. You need to earn their attention.
Direct selling fails on social. Building community and providing value works.
Facebook and Instagram Strategies
Instagram and Facebook dominate travel discovery. Sojern reports that 30% of travel marketers see Facebook as the most effective way to target new audiences, with 28% saying the same for Instagram.
According to Mize, the travel industry maintains an average 1.41% engagement rate on Instagram, the highest of any industry on the platform.
Profile Optimization for Lead Capture
Your bio is prime real estate. Make your value proposition clear in the first line.
“Custom Italy tours | Family-owned for 20 years | DM us to start planning” tells visitors exactly what you do.
Include a clear CTA. “Free destination guide in the link below” or “DM ‘ITALY’ for our insider’s guide” gives people an immediate action.
Story Highlights That Convert
Instagram Stories disappear after 24 hours unless you save them to Highlights. Organize highlights by destination or trip type.
WinSavvy reports that 87% of travel companies use Instagram Stories for marketing. Stories allow you to share real-time updates, behind-the-scenes content, and interactive elements.
Create highlights for FAQs, customer experiences, behind-the-scenes content, and special offers. Add links to relevant landing pages in your highlights to move interested followers toward booking.
Bio Link Strategies
Instagram only gives you one clickable link in your bio. Make it count.
Use link-in-bio tools that create a landing page with multiple options. Visitors can choose which destination guide or offer interests them.
Update your bio link regularly to match your current campaigns or seasonal promotions.
User-Generated Content Campaigns
Encourage customers to share their trip photos with a branded hashtag. Repost the best content (with permission) to your feed.
According to WinSavvy, user-generated content drives a 5x increase in engagement for travel brands. Data from CrowdRiff shows that 92% of consumers trust recommendations from friends and family on social media over other advertising.
Run contests where customers submit trip photos for a chance to win a discount on their next booking. This provides social proof, authentic content, and keeps your feed fresh without constant professional photography.
Paid Social Advertising That Works
Organic reach on social media keeps declining. Paid advertising gets your content in front of qualified travelers.
Targeting Travelers vs. Tourists
Platform targeting options let you find people based on travel behavior, interests, and demographics.
Target people who’ve engaged with travel content, follow travel pages, or have shown interest in specific destinations. Exclude recent travelers to those destinations. Someone who just got back from Thailand probably isn’t booking another Thailand trip this month.
Retargeting Website Visitors
Someone visited your Bali tour page but didn’t book. Show them ads about Bali tours for the next 30 days.
Cropink research shows that retargeted users are 43% more likely to convert than first-time visitors. DemandSage reports that retargeting campaigns achieve a 3.8% median conversion rate, significantly higher than prospecting campaigns at 1.5%.
According to NewswireJet data from 2025, the average user sees a retargeting ad 3.5 times before converting, but performance drops past 6 views. Segment your retargeting by which pages they visited. Show different ads to people who looked at luxury vs. budget options.
Retargeting Performance Benchmarks:
| Metric | Performance |
|---|---|
| Conversion rate increase | 150% |
| CTR vs. display ads | 10x higher |
| Conversion rate (median) | 3.8% |
| Optimal window | 7-14 days |
| Creative refresh frequency | Every 2 weeks |
Lookalike Audiences That Actually Convert
Upload your customer list to create lookalike audiences. Platforms find people similar to your best customers.
Focus Digital reports that lookalike audiences outperform interest-based targeting by 35%. A case study from TheAdSpend shows a supplement retailer achieving a 21.3% conversion rate using a Facebook lookalike audience based on 19,000 past customers.
Lookalike audiences based on high-value customers (people who’ve booked expensive trips) work better than lookalikes based on email subscribers. Start with 1-2% lookalikes (most similar to your source audience) before expanding to larger, less precise audiences.
Lookalike Audience Strategy:
- Source list size: 5,000-20,000 people for best results
- Start with 1-2% similarity (most precise)
- Test multiple audience tiers
- Exclude existing customers to avoid wasted spend
Lead Generation Ad Formats
Facebook and Instagram offer native lead forms that don’t require leaving the platform.
WordStream reports that lead generation campaigns achieve an 8.25% average conversion rate across industries in 2025. Focus Digital found that lead generation campaigns outperform traffic-based campaigns by 321%.
For travel specifically, GCG Media data shows travel businesses achieve a 6.62% click-through rate on Facebook lead ads, among the highest of any industry.
Pre-fill known information (name, email) to reduce friction. Ask 2-3 qualification questions max. Follow up immediately with leads from social ads. They go cold fast.
Lead Ad Optimization Checklist:
- Pre-fill name and email automatically
- Limit to 2-3 qualification questions
- Set up instant automated follow-up
- Test offers (guides vs. consultations)
- Respond to leads within 5 minutes
- Track lead quality, not just volume
Video Ad Strategies for Travel
Video ads stop scrolling better than static images. Show stunning destination footage, customer testimonials, or quick travel tips.
Sprout Social reports that vertical creative assets on YouTube Shorts deliver 10-20% more conversions per dollar compared to landscape formats. The first 3 seconds determine whether someone keeps watching. Start with your most compelling footage.
Add captions. Most people watch videos with sound off.
Pinterest for Travel Lead Generation
Pinterest functions as a visual search engine. People use it to plan future trips, making it perfect for early-stage lead generation.
Pinterest Newsroom reports over 1 billion travel-related searches and 10 billion travel saves in one year. WinSavvy data shows that 47% of travelers use Pinterest for travel inspiration.
Pin Designs That Get Clicks
Vertical pins (2:3 ratio) perform best. Include text overlay that clearly explains what the pin offers.
Bright, eye-catching images stand out in the feed. Avoid dark or muddy photos. Create templates for consistent branding across all your pins.
Boards That Attract Your Ideal Customer
Organize boards by destination, trip type, and travel theme. “Bali Family Vacation Ideas” is more specific than “Asia Travel.”
Pin regularly to each board. Pinterest rewards consistency. Follow other travel accounts and engage with their content to grow your own following.
Seasonal Pinning Strategies
Pin summer vacation content in January and February when people start planning. Holiday travel content should go up by August.
Pinterest users plan far in advance. Your content needs to appear months before the actual travel dates.
Driving Pinterest Traffic to Landing Pages
Every pin should link to a relevant landing page on your site. Not your homepage but a specific page that matches the pin content.
According to DemandSage, Pinterest ads are 2.3 times cheaper per conversion than other social platforms. Social Pilot reports that weekly Pinners are 3x more likely to click through to a retailer’s website compared to other social media users.
Create dedicated landing pages for your most popular pins to maximize conversion potential. Track which pins drive the most website traffic and double down on similar content.
Pinterest Conversion Performance:
| Metric | Performance |
|---|---|
| Cost per conversion | 2.3x lower than competitors |
| Click-through likelihood | 3x higher than other platforms |
| Purchase influence | 85% of weekly users |
| Planning timeline | 3-6 months in advance |
YouTube as a Lead Source
YouTube ranks as the second-largest search engine. Travel content performs particularly well because people want to see destinations before committing.
Sprout Social reports that YouTube’s potential ad reach totals 2.53 billion users. EditVideo.io data shows that travel vlogs account for 48% of travel channel subscriptions, with 4x more social engagement than other content types.
Video Types That Generate Travel Leads
Destination guides, hotel tours, packing tutorials, and travel vlogs all attract viewers planning similar trips.
“First-time visitor’s guide to Iceland” answers common questions and positions you as an expert resource. Behind-the-scenes content showing how you plan trips builds trust and demonstrates your value.
High-Performing Video Content:
- Travel vlogs (48% of subscriptions)
- Official brand channels (19% of subscriptions)
- Travel tours and footage (16%)
- Reviews, tips, how-to (11%)
- HD quality, vibration-free shots required
Description and Pinned Comment Strategies
Put your most important links in the first two lines of your video description. Everything else gets hidden behind “show more.”
Pin a comment with your current promotion or lead magnet to keep it visible. Include timestamps for longer videos. Viewers appreciate being able to jump to specific sections.
End Screens and Cards for Conversions
YouTube’s end screens let you promote other videos, playlists, or external websites in the last 5-20 seconds of videos.
Direct viewers to a relevant landing page or to your most popular destination guide video. Cards can appear anywhere in the video to promote additional content or capture leads mid-video.
Paid Advertising Channels That Deliver
Organic traffic takes time to build. Paid advertising generates immediate visibility and leads.
The key is spending money on channels where your target customers actually search for travel services.
Google Ads for Travel Companies
People searching for travel services have high intent. Google Ads captures this demand.
WordStream reports that travel has the second-lowest average cost per click at $1.92 across all industries. Champ Internet Solutions data shows that in 2023, the travel industry achieved a 10.03% click-through rate, significantly higher than the overall average of 6.11%.
Search Campaigns vs. Display Campaigns
Search campaigns show text ads to people actively searching for terms you target. These drive the highest-intent traffic.
Display campaigns show banner ads across Google’s network. Lower intent but useful for retargeting and brand awareness.
Start with search campaigns. They convert better for travel bookings. LocaliQ reports that the average conversion rate for travel search ads is 7.52% in 2025.
Campaign Performance Comparison:
| Campaign Type | Avg. CPC | Avg. CTR | Avg. Conversion Rate | Best Use |
|---|---|---|---|---|
| Search (Travel) | $1.92 | 8%+ | 7.52% | High-intent bookings |
| Display (Travel) | $0.63 | 0.35% | 0.57% | Awareness, retargeting |
Destination-Based Keyword Strategies
Target specific destinations plus your service type. “Bali honeymoon packages” or “guided tours Iceland” attract qualified searchers.
Long-tail keywords cost less and convert better than broad terms. “Luxury safari Kenya adults only” is more specific than “Africa tours.”
Create separate campaigns for each major destination. This improves ad relevance and quality scores.
Keyword Strategy Framework:
Tier 1 (Highest Intent):
- Destination + service + qualifier
- Example: “guided Iceland tours small groups”
- Expected CPC: Low
- Conversion rate: High
Tier 2 (Medium Intent):
- Destination + service
- Example: “Iceland tours”
- Expected CPC: Medium
- Conversion rate: Medium
Tier 3 (Lower Intent):
- Broad service terms
- Example: “Europe vacation packages”
- Expected CPC: Higher
- Conversion rate: Lower
Bidding on Competitor Terms
Advertising on competitor names can work but requires careful consideration. People searching for specific competitors may be loyal to those brands.
These clicks cost more and convert worse than destination-focused keywords typically. Test competitor terms with small budgets. If they don’t convert, invest elsewhere.
Remarketing Lists for Search Ads
Show different ads to people who’ve already visited your site when they search for relevant terms.
Someone who visited your Bali package page but didn’t book sees customized ads when they search for “best time to visit Bali.”
Cropink research confirms that retargeted users are 43% more likely to convert than first-time visitors. These remarketing search ads convert much better than ads shown to cold traffic.
RLSA Conversion Benchmarks:
| Audience Type | Expected Conversion Rate | Cost Per Lead Reduction |
|---|---|---|
| All visitors | 7.52% baseline | – |
| Page-specific visitors | 10-12% | 15-25% |
| Cart abandoners | 12-18% | 20-30% |
| Past customers | 15-20% | 30-40% |
Ad Extensions That Improve Conversions
Use all relevant ad extensions. Callout extensions, structured snippets, and site links make your ads larger and more informative.
Location extensions help if you have a physical office. Call extensions let mobile users call directly from the ad.
More extensions generally mean better ad performance and lower costs per click.
Essential Ad Extensions for Travel:
- Sitelinks: Link to top destinations, reviews, contact
- Callouts: “Free cancellation,” “24/7 support,” “Best price guarantee”
- Structured snippets: Destinations, trip types, included services
- Location: Office address (if applicable)
- Call: Phone number for mobile clicks
- Price: Show starting rates for packages
Metasearch Engines and OTAs
Google Travel, TripAdvisor, and similar metasearch platforms drive significant travel bookings.
Google Travel Integration
Google Travel pulls information from multiple sources to show flight and hotel options directly in search results.
Getting your offerings into Google Travel requires integration with their booking platform or partnership with a participating provider. This visibility is valuable but comes with commission costs or technical requirements.
TripAdvisor Advertising
TripAdvisor remains a major research tool for travelers. Advertising there reaches people actively comparing options.
Sponsored placements appear above organic results in destination searches. Click costs vary by destination and competition.
Maintain strong organic TripAdvisor presence (great reviews, complete profile) alongside any paid placement.
When to Use OTAs vs. Direct Booking Focus
Online travel agencies like Booking.com and Expedia provide visibility but take significant commissions.
According to CloudBeds, OTA commission rates now range from 15-30%, up from around 10% in previous years. PrenoHQ reports that Booking.com and Expedia typically charge 15-25% commission depending on location and property type.
The Hotel Blueprint reports that Booking Holdings and Expedia Group combine for over 40% of global OTA market share. In 2025, Booking Holdings reported $46.7 billion in gross bookings with 8% room night growth.
For new companies, OTA presence helps build credibility and reviews. For established brands, focusing on direct bookings improves margins.
OTA vs. Direct Booking Decision Matrix:
| Stage | OTA Strategy | Direct Strategy | Why |
|---|---|---|---|
| New business (0-6 months) | High reliance | Minimal | Build reviews, credibility |
| Growing (6-24 months) | Medium reliance | Building | Balanced visibility and margin |
| Established (24+ months) | Strategic use | Primary focus | Maximize profit margins |
OTA Commission Comparison:
| Platform | Commission Rate | Market Strength | Best For |
|---|---|---|---|
| Booking.com | 15-25% | Europe (69.3% share) | European travelers |
| Expedia Group | 15-30% | North America (55%+ bookings) | US travelers |
| Agoda | ~16% | Asia-Pacific | Asian market |
| Airbnb | 15% (host) + guest fees | Global | Unique properties |
| Hotels.com | 15-30% (Expedia owned) | North America | Package deals |
Many travel companies use a hybrid approach: maintain OTA presence for visibility while optimizing direct channels for conversions.
Reducing OTA Dependency Strategy:
High Season:
- Reduce OTA inventory allocation
- Focus on direct channels
- Increase direct marketing spend
- Target: 60% direct bookings
Low Season:
- Increase OTA visibility
- Use OTAs to fill gaps
- Accept higher commissions for occupancy
- Target: 40% direct bookings
Display and Retargeting Campaigns
Display ads work best for remarketing rather than cold prospecting.
According to WifiTalents, the average CTR for display ads is 0.35%, while retargeting ads achieve 2-3x higher conversion rates than prospecting campaigns. Keywords Everywhere reports that combining targeted audiences with display remarketing can boost conversion rates by 40% or more.
Banner Ad Design for Travel
Use high-quality destination images that evoke emotion and wanderlust. Stunning visuals matter more in travel than most industries.
Include clear offers or CTAs. “Bali tours from $1,299” gives concrete information.
Keywords Everywhere data shows that video display ads have an 89% higher click-through rate compared to static banners.
Test multiple creative variations. What appeals to luxury travelers differs from budget-conscious ones.
Display Ad Performance by Format:
| Format | Average CTR | Best Use Case |
|---|---|---|
| Standard banner | 0.35% | General awareness |
| Video ads | 0.66% (89% higher) | Destination showcase |
| Native ads | 0.53% (53% higher than banners) | Content integration |
| Rich media | Variable | Interactive experiences |
Retargeting Visitors Who Abandoned Booking
Someone who started but didn’t complete a booking represents a hot lead. Show them ads encouraging completion.
DemandSage reports that retargeting can reduce cart abandonment rates by at least 6.5%. The median conversion rate for retargeting campaigns is 3.8%, significantly higher than prospecting campaigns at 1.5%.
Offer incentives if needed. “Complete your booking in the next 24 hours for 5% off” creates urgency. Exclude people who actually completed bookings. No point spending money on customers you’ve already converted.
Retargeting Conversion Performance:
| Audience Segment | Expected CTR | Expected Conversion Rate | Days to Convert |
|---|---|---|---|
| Homepage visitors | 0.7% (10x standard) | 2-3% | 14-21 days |
| Destination page visitors | 1.2% | 4-6% | 7-14 days |
| Pricing page visitors | 1.8% | 6-9% | 3-7 days |
| Cart abandoners | 2.5%+ | 10-15% | 1-3 days |
Sequential Retargeting Messages
Show different ads based on how long ago someone visited. Day 1 might remind them about their interest. Day 7 might offer a discount. Day 14 might introduce alternative dates or destinations.
NewswireJet data from 2025 shows that the average user sees a retargeting ad 3.5 times before converting, but performance drops past 6 views.
This progression feels more natural than showing the identical ad for weeks. Cap frequency to avoid annoying potential customers with constant ad bombardment.
Partnerships and Referral Programs
Growing your lead pipeline doesn’t mean doing everything alone. Strategic partnerships multiply your reach without multiplying your workload.
The right collaborations put your services in front of qualified audiences who already trust your partners.
Travel Blogger and Influencer Collaborations
Travel influencers have built audiences of people who love to travel. That’s exactly who you need to reach.
Influencer Marketing Hub reports that the influencer marketing industry will reach $32.55 billion in 2025, up from $24 billion in 2024. According to Thunderbit, businesses earn $6.50 for every $1 spent on influencer marketing, with top performers seeing up to $20 per dollar spent.
Goat Agency data shows that 33% of influencer marketers work with travel creators, making it the fifth most popular influencer category after fashion, lifestyle, fitness, and food.
Finding the Right Partners for Your Niche
Don’t chase follower counts. A micro-influencer with 10,000 engaged followers in your niche beats a macro-influencer with 500,000 disengaged followers.
Influencer Marketing Hub research shows that nano-influencers (under 10K followers) achieve a 1.73% average engagement rate, significantly higher than macro-influencers at 0.61% and mega-influencers at 0.68%.
Look for alignment in travel style and target demographics. Luxury travel influencers won’t effectively promote budget tours. Check engagement rates, not just follower numbers. Comments and shares matter more than vanity metrics.
Influencer Performance by Tier:
| Influencer Type | Follower Count | Avg. Engagement Rate | Cost Efficiency | Best For |
|---|---|---|---|---|
| Nano | 1K-10K | 1.73% | Highest | Niche destinations, authentic content |
| Micro | 10K-100K | 1.2-1.5% | High | Targeted campaigns, specific demographics |
| Macro | 100K-1M | 0.61% | Medium | Broader reach, brand awareness |
| Mega | 1M+ | 0.68% | Lower | Mass market, large campaigns |
Compensation Models That Work
Some influencers want cash payments. Others prefer free trips in exchange for content.
Commission-based partnerships work well when tracking is solid. Pay per booking rather than per post when possible.
Hybrid models combining a smaller upfront payment with performance bonuses align incentives. Both parties win when bookings happen.
Influencer Compensation Framework:
Free Trip + Content:
- Best for: Micro-influencers, destination launches
- Value: $2,000-$5,000 (trip cost)
- Expected deliverables: 5-10 posts, stories, video content
- Tracking: Unique discount codes
Cash Payment:
- Best for: One-time campaigns, specific content needs
- Nano: $100-$500 per post
- Micro: $500-$5,000 per post
- Macro: $5,000-$50,000+ per post
Commission-Based:
- Best for: Ongoing partnerships, affiliate relationships
- Structure: 10-15% of booking value
- Cookie duration: 30-60 days
- Minimum booking: Usually required
Hybrid Model (Recommended):
- Upfront payment: 50% of standard rate
- Commission: 5-10% on bookings
- Benefits: Shared investment, aligned incentives
Tracking Conversions From Influencer Campaigns
Give each influencer a unique discount code or tracking link. This shows exactly which bookings came from which partnership.
Influencer Marketing Hub data shows that influencers created 1.4 billion posts generating $236 billion in Earned Media Value in 2024, representing an 8.4x return on investment.
Most influencer ROI is terrible if you only track immediate conversions. Factor in brand awareness and longer-term impact.
Set clear expectations upfront about deliverables, timeline, and measurement criteria.
Tracking Metrics Table:
| Metric | Track This | Industry Benchmark | Your Target |
|---|---|---|---|
| Reach | Total impressions | Varies by tier | |
| Engagement rate | Likes, comments, shares | 1-2% average | |
| Click-through rate | Link clicks | 2-5% | |
| Conversion rate | Bookings from traffic | 2-4% | |
| Cost per acquisition | Total spend ÷ bookings | $100-$300 travel | |
| Earned media value | Reach × engagement | 8.4x ROI average |
Long-Term Partnerships vs. One-Off Promotions
One campaign with an influencer builds minimal trust with their audience. Ongoing partnerships create stronger associations.
Regular collaborations (quarterly trip features, monthly destination spotlights) keep your brand visible to their followers.
Long-term relationships often come with better rates as influencers value reliable partnership income.
Micro-Influencers vs. Macro-Influencers
Micro-influencers (10K-100K followers) typically have higher engagement and more affordable rates. Their audiences tend to trust their recommendations more.
DemandSage reports that micro-influencers are preferred 10 times more by brands than mega-influencers. Sprout Social data shows that 80% of marketers work with smaller creators under 100K followers.
Macro-influencers provide broader reach but lower engagement percentages and higher costs. Test both to see what delivers better ROI for your specific audience and budget.
Affiliate Program Setup
Affiliates promote your services and earn commissions on bookings. You only pay for actual results.
Commission Structures That Attract Affiliates
Travel bookings have high values, so you can offer meaningful commissions. 10-15% on tour packages provides solid affiliate income.
Tiered commissions reward top performers. Start at 10% and increase to 15% after 10 bookings per month. Consider offering higher commissions for specific destinations or dates you’re trying to fill.
Affiliate Commission Structure:
| Performance Tier | Monthly Bookings | Commission Rate | Example Earnings (avg $2,000 booking) |
|---|---|---|---|
| Bronze | 1-5 | 10% | $200-$1,000/month |
| Silver | 6-10 | 12% | $1,440-$2,400/month |
| Gold | 11-20 | 15% | $3,300-$6,000/month |
| Platinum | 21+ | 18% | $7,560+/month |
Bonus Incentives:
- First booking bonus: Extra $50
- Quarterly milestone: $500 for 25+ bookings
- Top performer: $1,000 annual bonus
Providing Marketing Materials
Make affiliate success easy. Provide banner ads, email templates, social media graphics, and sample content.
The easier you make promotion, the more affiliates will actually promote. Don’t expect them to create everything from scratch. Update materials seasonally to keep promotions fresh and relevant.
Affiliate Marketing Kit Checklist:
- 5 banner ad sizes (300×250, 728×90, 160×600, 320×50, 300×600)
- 3 email templates (introduction, seasonal, urgency)
- 10 social media images with captions
- Destination photos (high-resolution, 20+ per location)
- Video clips (30-60 seconds, 5+ destinations)
- Sample blog post outlines (3 topics)
- Product comparison chart
- FAQ document
- Brand guidelines PDF
- Promotional calendar (quarterly updates)
Affiliate Software and Tracking
Dedicated affiliate platforms handle tracking, commission calculation, and payment processing automatically.
Cookie duration matters. 30-day cookies mean affiliates get credit if someone books within 30 days of clicking their link. Travel has longer consideration periods. Consider 60 or 90-day cookie windows to fairly credit affiliates.
Affiliate Platform Settings:
- Cookie duration: 60-90 days (travel consideration cycle)
- Payment schedule: Net 30 after travel completion
- Minimum payout: $100
- Payment methods: PayPal, bank transfer, check
- Tracking: First-click attribution
- Fraud detection: Enabled
Recruiting Quality Affiliates
Travel bloggers, destination websites, and complementary service providers make ideal affiliates.
Reach out personally to high-quality prospects rather than waiting for applications. “We love your Italy content and think our tours would be perfect for your audience.”
Vet applicants. Low-quality sites damage your brand even if they generate a few bookings.
Target Affiliate Profile:
Ideal Affiliates:
- Travel bloggers (5K+ monthly visitors)
- Destination guides and resources
- Travel photographers and videographers
- Tour review sites
- Travel forums and communities
- Complementary services (travel insurance, gear shops)
Outreach Template: “Hi [Name], I’ve been following your [destination] content and love how you showcase [specific aspect]. We run [type] tours to [destinations] and think they’d be perfect for your audience. We offer 10-15% commissions with 60-day cookies. Would you be interested in partnering? Here’s our media kit: [link]”
Managing and Motivating Your Affiliate Team
Regular communication keeps affiliates engaged. Monthly newsletters with top performers, new promotions, and marketing tips help.
Bonuses for hitting milestones motivate extra effort. “Book 20 trips this quarter and earn a $500 bonus” incentivizes focus.
Some affiliates need more support than others. Provide one-on-one help to promising partners who aren’t converting yet.
Monthly Affiliate Newsletter Template:
- Top performers (with earnings)
- New destinations/packages
- Seasonal promotions
- Marketing tip of the month
- Success story spotlight
- Upcoming milestone bonuses
- Updated marketing materials
Strategic Business Partnerships
Look beyond typical affiliate relationships to complementary businesses serving your target market.
Hotel and Accommodation Partnerships
Partner with hotels in your key destinations. You send them bookings, they recommend your tours to their guests.
Co-create packages combining accommodation with your services. “Book a week at this resort and add our cultural tours at 20% off.”
Cross-promotion benefits both businesses without direct costs.
Local Tour Operator Collaborations
If you focus on certain destinations, partner with operators in places you don’t cover. Refer customers to each other.
This expands your offerings without building expertise in every destination. “We don’t offer Japan tours, but our trusted partner does.”
Revenue share agreements work when you send business their way and vice versa.
Partnership Revenue Share Model:
- Referral commission: 10-15% of booking value
- Co-branded packages: 50/50 revenue split
- Bundle offerings: Negotiate per partnership
- Minimum referrals: 5 per quarter to maintain partnership
Transportation Provider Relationships
Partner with shuttle services, car rental companies, or private drivers in your destinations.
Bundled offers simplify logistics for travelers. “Airport transfers included with every tour booking” adds value. These partnerships can generate referral income while improving customer experience.
Restaurant and Attraction Partnerships
Negotiate group rates or exclusive access with popular attractions. This differentiates your offerings from competitors.
“Skip-the-line access to the Colosseum” or “private after-hours museum tours” become unique selling points. Restaurant partnerships for group dinners create memorable experiences and often include commissions.
Cross-Promotion Strategies
Feature partner businesses in your marketing materials. They do the same for you.
Joint email campaigns to combined audiences multiply reach. “Our customers might also love your services” introductions feel natural.
Co-host webinars or create shared content (destination guides featuring each other’s services) that benefits both brands.
Customer Referral Programs
Your happiest customers already tell friends about their trips. Structure incentives to encourage more referrals.
According to Propello Cloud, referral marketing generates 3-5x higher conversion rates than other marketing channels. DemandSage research shows that 92% of consumers trust referrals from family and friends.
Impact data reveals that referred customers have a 16% higher lifetime value and 37% higher retention rate than non-referred customers.
Incentive Structures That Motivate Referrals
Both sides need motivation. Give the referrer a discount on their next trip and the referred friend a discount on their first booking.
ReferralCandy reports that double-sided rewards (benefiting both parties) make up 91.2% of all referral programs. Prefinery data shows that referred customers spend 25% more on their initial purchase.
“Refer a friend: You both get $100 off” creates win-win situations. Cash incentives work too, but travel credits keep money in your ecosystem.
Referral Incentive Benchmarks:
| Reward Type | Referrer Gets | Friend Gets | Conversion Impact | Cost per Acquisition |
|---|---|---|---|---|
| Double-sided discount | $100 off next trip | $100 off first trip | Highest (3-5x) | $200 |
| Cash + discount | $50 cash | $100 off | High | $150 |
| Tiered rewards | $50-$150 based on bookings | $100 off | High | Varies |
| Travel credits | $150 credit | $100 credit | Medium-high | $250 credit |
| Single-sided | $200 off | Nothing | Lower | $200 |
Expected Performance:
- Share rate: 5-15% of customers
- Conversion rate: 3-5% (vs. 2.35% industry average)
- Referral rate: 10-35% of new bookings
Making Referrals Easy to Share
Provide pre-written messages customers can send. “I just had an amazing trip to Peru with [Company]. You’d love their tours too. Here’s $100 off your first booking: [link]”
One-click sharing to email, text, and social media removes friction. Personal referral links track which customer generated which booking for accurate credit attribution.
Tracking and Rewarding Referrers
Automated systems track referrals and apply credits without manual work.
Send thank-you messages when referrals book. “Sarah’s booking just earned you $100 in travel credit. Thanks for sharing!”
Top referrers deserve special recognition. Feature them in newsletters or offer VIP perks.
Referral Program KPIs:
| Metric | Target | Track This |
|---|---|---|
| Referral rate | 10-35% of new customers | Monthly new bookings from referrals |
| Share rate | 5-15% of customers | % who share referral link |
| Click-through rate | 10-25% | Clicks on shared links |
| Conversion rate | 3-5% | % of clicks that book |
| Average referral value | $2,000+ | Booking size from referrals |
| Cost per acquisition | 50% less than ads | Total rewards ÷ new customers |
Timing Referral Requests
Ask for referrals when satisfaction peaks. Right after a successful trip, while memories are fresh and excitement is high.
Feedback forms at trip end can include referral requests. “Would you recommend us to friends? Share your unique link.”
Don’t ask too early. Someone halfway through a trip hasn’t experienced enough to confidently refer yet.
Double-Sided vs. Single-Sided Rewards
Double-sided rewards (both referrer and referee get benefits) perform better. They feel fairer and give people a reason to actually use referred links.
Review42 data shows that referral leads have a 30% higher conversion rate than contacts acquired by other means. Talkable research reveals that companies with referral programs see a 24% reduction in customer acquisition costs.
Single-sided rewards only benefit the referrer. These work when the person being referred would book anyway. Test different reward amounts to find the sweet spot that motivates sharing without killing margins.
Offline Lead Generation Methods
Digital marketing dominates, but offline tactics generate quality leads.
Research from Moots shows that 81% of trade show attendees have buying authority, making face-to-face interactions a direct path to decision-makers. According to Trade Show Labs, companies achieve 4:1 ROI at major trade shows, earning $4 for every dollar spent on exhibiting.
Certain demographics respond better to traditional approaches. Data from PostGrid reveals that 82% of consumers trust print advertisements when making purchases, and 70% find direct mail more personal than digital communications.
Travel Shows and Expos
Travel industry events concentrate qualified prospects in one place. Cvent data shows 72% of attendees are more likely to buy from exhibitors they meet, and 51% request a follow-up visit post-event.
Trade Show Labs reports that 5-10% of trade show leads convert when properly followed up. The catch? Moots research reveals that 80% of exhibitors fail to follow up on their leads.
Booth Design That Attracts Visitors
Stunning visuals stop people walking past. Large destination photos and video displays create instant interest.
Interactive elements increase engagement. Touch screens, VR headset destination previews, and photo opportunities pull visitors in.
Keep booth messaging clear and simple. Visitors spend 30 seconds deciding whether to stop or keep walking.
Booth Attraction Elements:
| Element Type | Impact | Implementation Cost |
|---|---|---|
| Large-format destination photos | High foot traffic | $500-2,000 |
| Video displays (looping footage) | Extended engagement | $1,000-3,000 |
| VR destination previews | Highest engagement | $2,000-5,000 |
| Photo opportunities (branded) | Social sharing | $300-1,500 |
| Touch screen itinerary builders | Lead capture + value | $1,500-4,000 |
Lead Capture at Events
Digital lead capture beats business card collection. Research from PassiveSecrets shows 62% of exhibitors now use lead retrieval apps, reducing friction and capturing complete contact data.
Tablets or phones with simple forms work better than paper. Badge scanners grab contact information instantly if the event provides them.
Follow up within 48 hours. Moots data shows 50% of trade show buyers choose the vendor that responds first with relevant information.
Offer something valuable in exchange for information. Contest entries, free consultations, or exclusive show discounts motivate sign-ups.
Lead Capture Performance Benchmarks:
| Method | Capture Rate | Data Quality | Follow-up Speed |
|---|---|---|---|
| Badge scanner | 85-95% | Excellent | Immediate |
| Tablet form | 60-75% | Very good | Same day |
| Business cards | 40-50% | Poor | 2-3 days |
| Paper forms | 30-45% | Fair | 3-5 days |
Following Up With Trade Show Leads
Trade show leads go cold fast. Email everyone within 24-48 hours referencing your conversation.
The optimal follow-up window is 24 to 48 hours after the event, according to Moots. Wait longer and engagement rates drop dramatically.
Personalize follow-up based on their specific interests. Generic emails waste the connection you built at your booth.
Call high-potential leads within a week. Voice conversations convert better than email alone for qualified prospects. PassiveSecrets research shows it takes 3.5 sales calls on average to close a trade show lead, but converting these leads is 38% less expensive than relying on sales calls alone.
Speaking Opportunities at Travel Events
Speaking positions you as an expert and generates leads without direct selling. PassiveSecrets data reveals 70% of exhibitors report increased lead generation through trade show participation, with speaking opportunities amplifying this effect.
Topics like “Hidden Gems in [Destination]” or “Planning Your First International Trip” attract ideal prospects.
Collect attendee contact information through registration forms and follow up with presentation slides plus your services overview.
Speaking Opportunity ROI:
| Opportunity Type | Avg. Attendees | Lead Quality | Conversion Rate |
|---|---|---|---|
| Keynote (main stage) | 200-500 | High | 8-12% |
| Breakout session | 30-100 | Very high | 12-18% |
| Panel discussion | 50-150 | High | 10-15% |
| Workshop (hands-on) | 15-40 | Highest | 18-25% |
Networking Strategies That Generate Leads
Other exhibitors and speakers can become referral partners. Travel photographers, wedding planners, and corporate event coordinators all work with your target customers.
Don’t just collect cards. Have real conversations about potential collaborations. “Our clients often need photography. I’d love to recommend you.”
Follow up on promising connections within a week. “Great meeting you at the expo. Let’s talk about how we might refer business to each other.”
Referral Partner Prospects at Travel Shows:
- Destination photographers (need travel bookings for photo tours)
- Wedding planners (coordinate destination weddings)
- Corporate event coordinators (organize incentive trips)
- Luxury travel bloggers (collaborate on content)
- Hotel representatives (cross-refer complementary services)
- Tour operators (package deals and partnerships)
Local Community Engagement
Your local community contains potential customers and referral sources. Splash research shows 78% of organizers identify in-person events as their organization’s most impactful marketing channel.
Building local presence generates consistent leads. Companies experience 10x the ROI from event attendees versus non-attendees, according to Splash.
Travel Planning Workshops and Seminars
Host free educational sessions at libraries, community centers, or your office. “Planning Your Dream European Vacation” attracts people considering trips.
Provide genuine value without hard selling. Education-first approaches build trust and position you as the expert to hire when ready.
Collect email addresses from attendees for follow-up nurturing.
Partnerships With Local Businesses
Connect with businesses serving similar demographics. Financial advisors have clients who take luxury vacations. Wedding dress shops have brides planning honeymoons.
Cross-promote services. Display their brochures, they display yours. Refer customers to each other.
Co-host events combining your expertise. “Destination Wedding Planning Night” with a venue coordinator attracts engaged couples.
High-Value Partnership Categories:
| Business Type | Shared Customer Profile | Partnership Opportunity |
|---|---|---|
| Financial advisors | High-net-worth, 40-65 | Retirement travel planning workshops |
| Wedding venues | Engaged couples, 25-35 | Honeymoon planning sessions |
| Luxury car dealerships | Affluent, status-conscious | European driving tour packages |
| Country clubs | Affluent, social | Group travel programs |
| Corporate event planners | Business travelers | Incentive trip planning |
Community Event Sponsorships
Sponsor local events where your target demographics gather. Keevee research shows 65% of consumers prefer brands that sponsor meaningful causes, and social impact sponsorships saw 21% year-over-year growth in 2024.
Sponsorships include booth space, logo placement, and often speaking opportunities. These build local brand awareness.
Choose events strategically. A luxury travel company sponsoring a high-end charity auction makes sense. Sponsoring a budget community event doesn’t.
Event Sponsorship Decision Matrix:
| Factor | Evaluate | Green Light Indicators |
|---|---|---|
| Audience alignment | Does attendee profile match ideal customer? | 70%+ match on income, age, interests |
| Visibility | Logo placement, booth space, speaking slot? | Multiple touchpoints included |
| Cost per attendee | Total cost divided by expected attendance | Under $25 per qualified prospect |
| Exclusivity | Are competitors also sponsoring? | Category exclusivity guaranteed |
| Follow-up access | Can you capture attendee data? | Contact list or booth traffic |
Sponsorship ROI Tracking:
- Leads captured at event
- Social media mentions and reach
- Brand awareness lift (survey attendees)
- Closed deals attributed to event
- Referral partnerships formed
- Media exposure value
Library and Community Center Presentations
Public libraries welcome free educational programming. Offer destination talks or travel planning workshops.
These reach engaged community members at no venue cost. Libraries promote your session through their channels.
Bring handouts with your contact information. Offer private consultations to interested attendees.
Library Presentation Topics That Attract Travelers:
- “10 Essential Tips for First-Time International Travelers”
- “Hidden Gems of [Popular Destination]”
- “How to Plan a Multi-Week European Adventure”
- “Travel Photography: Capturing Your Journey”
- “Solo Travel Safety and Planning”
- “Traveling on a Budget Without Sacrificing Experience”
Travel Club Collaborations
Many communities have senior travel clubs or general interest travel groups. Offer to present at their meetings.
Club members actively plan trips and influence each other’s decisions. One happy club member can generate multiple bookings.
Offer club-exclusive discounts or group rates to incentivize bookings.
Print and Direct Mail
Digital fatigue makes physical marketing stand out. Postalytics research shows 84% of marketers agree that direct mail delivers the best ROI of any channel they use, with 85% saying it delivers the best conversion rate.
Targeted print campaigns reach demographics who don’t live online. Data from REsimpli reveals direct mail has an average ROI of $42 for every $1 spent, while PostGrid reports a 29% ROI compared to only 16% for online display and 23% for paid search.
When Print Advertising Still Works
Luxury travel buyers still read travel magazines. Dialogue Agency reports that luxury magazine readers are 45% more likely to buy luxury goods, making print an attractive choice for prestigious brands.
Travel + Leisure and Condé Nast Traveler reach affluent travelers planning high-end trips. Research from News Media Alliance shows nearly 87% of American adults engaged with magazine media in recent months.
Regional lifestyle magazines target local residents with disposable income. Perfect for promoting international tours or destination weddings.
Print works when the publication’s audience aligns closely with your ideal customer profile. ProfileTree research shows 73% of consumers prefer receiving print advertisements over other forms of advertising.
Print Advertising Effectiveness by Publication Type:
| Publication Type | Reader Profile | Ad Cost Range | Expected Response | Best For |
|---|---|---|---|---|
| Luxury travel magazines | HHI $150K+, age 45-65 | $8,000-25,000 | 2-4% | High-end tours, luxury cruises |
| Regional lifestyle | HHI $100K+, local | $2,000-8,000 | 3-6% | Local departures, destination weddings |
| Senior magazines | Age 55+, retired | $3,000-10,000 | 4-7% | Group tours, river cruises |
| Airline magazines | Frequent travelers | $10,000-30,000 | 1-3% | Business travel, luxury packages |
Postcard Campaigns to Past Customers
Send postcards featuring destinations they haven’t visited yet. “Loved Thailand? Discover Vietnam next.”
Physical mail gets opened more than emails. Postalytics data shows 80-90% open rate for direct mail versus 20-30% for email.
Include a specific offer with expiration date. “Book by [date] and save $200 on any Southeast Asia tour.”
Postcard Campaign Performance:
According to UPrinting research:
- Direct mail achieves 4.4% average response rate versus 0.12% for email
- 9% response rate for in-house mailing lists
- 5% response rate for purchased lists
ModernPostcard reports that direct mail to house lists delivers 161% average ROI, the highest of any paid marketing channel.
Postcard Campaign Strategy:
Segmentation Approach:
- Past customers by destination type (beach vs. culture vs. adventure)
- Time since last trip (6 months, 1 year, 2 years)
- Average booking value (budget, mid-range, luxury)
- Travel frequency (occasional vs. frequent travelers)
Offer Structure:
- Early booking discount ($200-500 off)
- Exclusive departure dates
- Complimentary upgrades
- Limited availability messaging
Tracking Methods:
- Unique booking code on postcard
- Dedicated phone number
- Custom landing page URL
- QR code for mobile response
Magazine Advertising in Travel Publications
Full-page ads in travel magazines cost thousands but reach tens of thousands of qualified readers.
FinancesOnline reports that magazine advertising provides $3.94 average return for every dollar spent.
Test smaller ads first to gauge response before committing to large placements.
Track responses using unique URLs or phone numbers to measure ROI on expensive magazine ads.
Local Newspaper Strategies
Local newspapers still reach older, affluent residents who travel frequently. Persuasion Nation research shows 70% of households earning above $100,000 are newspaper readers.
Travel section advertising on Sundays captures people in trip-planning mode.
Community newspapers cost less and target specific geographic areas if you focus on local clientele. Amra And Elma data reveals newspaper advertising represents $33.35 billion of the print market in 2024.
Local Newspaper Ad Performance:
ElectroIQ reports 9% average response rate for print ads, far ahead of digital’s 1%.
Newspaper Placement Strategy:
| Day | Section | Best For | Expected Response |
|---|---|---|---|
| Sunday | Travel section | All travel types | 4-6% |
| Sunday | Lifestyle | Luxury, cultural trips | 3-5% |
| Wednesday | Local news | Day trips, weekend getaways | 2-4% |
| Saturday | Weekend edition | Last-minute deals | 3-5% |
Direct Mail to Targeted Demographics
Purchase mailing lists targeting specific demographics. Households earning $150K+ in your city who’ve traveled internationally in the past year.
Personalized letters outperform generic postcards. “As a fellow [neighborhood] resident who values authentic cultural experiences…”
Postalytics research shows adding a name to direct mail increases response rates by 135%, and 52% of consumers expect direct mail to be personalized.
Include a compelling reason to respond now. Limited spots, early booking discounts, or exclusive information access.
Direct Mail Campaign ROI Tracking:
According to multiple sources, direct mail generates:
- 73% of purchase decisions happen within 1+ day (UPrinting)
- 39% of customers try a business for first time because of direct mail (Postalytics)
- 56% of people tried a new business in past 6 months from receiving mail (UPrinting)
Direct Mail Campaign Framework:
List Selection:
- Income level ($100K+ for luxury travel, $75K+ for mid-range)
- Recent travel history (international travel in past 2 years)
- Age range (align with your typical customer)
- Geographic radius (within service area)
Creative Execution:
- Personalized letter format (not generic postcard)
- Compelling headline referencing their neighborhood
- High-quality destination imagery
- Clear, limited-time offer
- Easy response mechanism (QR code, phone, URL)
Campaign Timing:
- January-February (planning spring/summer trips)
- July-August (booking fall/winter travel)
- Avoid December (holiday mail overload)
Expected Results:
- 5.1% response rate (Persuasion Nation)
- 15.6% response for house file campaigns (ModernPostcard)
- 28% increase in conversion rates when combined with digital (UPrinting)
Integration with Digital:
UPrinting research shows combining direct mail with digital increases:
- Conversion rates by 28%
- Website visits by 77%
- Brand recall by 75%
- Attention by 39%
Send direct mail, then follow up with:
- Email to same list 3-5 days later
- Retargeting ads to mail recipients
- Social media ads in target ZIP codes
- SMS for immediate responders
Cost-Per-Lead Benchmarks:
According to SeoProfy and EmailTooltester, events and trade shows have the highest average CPL at $811, making targeted direct mail at approximately $150-250 per lead a cost-effective alternative for reaching quality prospects.
Conversion Rate Optimization for Travel Sites
Driving traffic means nothing if visitors don’t convert.
Research from Contentsquare shows desktop travel sites achieve 7.6% conversion rates while mobile converts at just 2.6%. This 3x gap reveals massive optimization opportunity.
Keywords Everywhere reports the average travel industry conversion rate sits at 2.4%, but Blogging Wizard data shows this varies dramatically by channel. Email marketing converts travel prospects at 3.3%, while social media achieves just 2.7%.
Small changes to your booking process can dramatically increase revenue. Most travel sites leak potential customers at predictable points.
Trust-Building Elements
Travelers hand over thousands of dollars. They need confidence you’ll deliver what you promise.
Crazy Egg research shows 94% of shoppers are likely to complete purchases when Norton Secured Seals appear at checkout. Nestify reports that adding a Verisign trust badge increased form conversions by 42%.
Security Badges and Certifications
Display SSL certificates, payment security badges, and trust seals prominently on booking pages.
Trust Badge Performance:
According to WiserNotify analysis, trust badges can improve conversion rates by up to 42%. Multiple studies confirm their effectiveness:
- 77% of online shoppers are more familiar with Norton Secured Seal than competitor seals (Synovate via Crazy Egg)
- 65% of shoppers feel Norton Secured Seal means the site won’t give them a virus (Synovate)
- Blue Fountain Media testing showed 42% conversion rate increase with Verisign badge addition
- VeriSign EV certificates delivered 30% conversion increase for hotel booking industry (Nestify)
Travel industry accreditations (ASTA, IATA, or similar) prove legitimacy. Show them.
“Secure booking” or “Safe payment” messaging near purchase buttons reduces anxiety.
Badge Placement Strategy:
| Location | Impact | When to Use |
|---|---|---|
| Checkout page (near payment) | Highest | Critical for all sites |
| Homepage footer | Brand credibility | High-value bookings |
| Booking button proximity | Reduces hesitation | All booking pages |
| Form submission pages | Builds confidence | Lead capture forms |
Customer Reviews and Testimonials
Video testimonials from real customers build trust better than written reviews alone. Seeing satisfied travelers talk about their experiences is powerful.
Display reviews prominently on destination pages, not hidden on a separate testimonials page.
Respond to all reviews, positive and negative. This shows you care about customer satisfaction.
Review Impact on Conversions:
Research shows:
- 82% of consumers trust print ads when making purchases (PostGrid), demonstrating inherent trust in traditional proof
- Social proof combined with countdown timers increases effectiveness by 35-40% (Poper)
- 61% of consumers trust reviews and testimonials (multiple sources)
Industry Affiliations and Awards
Memberships in recognized travel organizations signal professionalism and accountability.
Awards from industry publications or travel platforms deserve homepage placement. “TripAdvisor Travelers’ Choice Award 2024” carries weight.
Media mentions build credibility. “Featured in Travel Weekly” or “Recommended by Lonely Planet” impresses visitors.
Money-Back Guarantees
Money-back guarantees reduce perceived risk.
Visual Website Optimizer testing showed 30-day money-back guarantee badges increased sales by 32% over an 11-day period for an online education service (Oberlo).
“Cancel up to 30 days before departure for full refund” makes booking easier.
Clear cancellation policies prevent objections before they happen. Ambiguity creates hesitation.
Guarantee satisfaction explicitly. “Love your trip or we’ll make it right” statements, backed by your reputation, build confidence.
Guarantee Badge Effectiveness:
- 32% sales increase with money-back guarantee display (Visual Website Optimizer)
- Eliminates perceived risk of buying online
- Particularly effective for high-value travel purchases
Contact Information Visibility
Display phone numbers prominently. Available customer service reassures prospects they can reach real people.
Physical address visibility matters too. Post-office-box-only businesses feel less legitimate than those with real offices.
Live chat availability signals accessibility. Even if chat volume is low, the option itself reduces anxiety.
Contact Visibility Elements:
- Phone number in header (visible on all pages)
- Physical office address in footer
- Live chat widget
- Response time expectations (“We respond within 2 hours”)
- Business hours clearly stated
Booking Process Optimization
Every extra step between “I want to book” and “booking confirmed” loses customers.
Scoop Market data reveals a one-second delay in page load time causes a 7% reduction in conversions. For mobile, 53% of visitors abandon pages taking longer than 3 seconds to load.
Simplify ruthlessly.
Reducing Steps to Booking
Three-page checkout beats five-page checkout. Every additional click provides an exit opportunity.
According to Picreel research, reducing form fields from three to two improves conversions by over 200%. Drip’s analysis shows:
- One field: Good performance
- Two fields: Best performance (optimal)
- Three fields: 200%+ drop from two fields
- Four-five fields: Significant further decline
Combine related information on single pages where logical. Traveler info and payment details can coexist.
Show progress indicators so bookers know how many steps remain. Uncertainty about process length increases abandonment.
Checkout Flow Optimization:
Step 1: Trip Selection
- Destination, dates, travelers
- Price display (all-in, no surprises)
Step 2: Traveler Details + Payment
- Minimize fields (name, email, phone, payment)
- Auto-fill capability
- Guest checkout option
Step 3: Confirmation
- Immediate confirmation
- Clear next steps
- Upsell opportunities (travel insurance, upgrades)
Benchmark: Reduce to 2-3 pages maximum
Guest Checkout vs. Account Creation
Forcing account creation before booking kills conversions.
Offer guest checkout with optional account creation after booking.
“Create account to track your booking” feels less intrusive than mandatory signup before purchase.
Let customers complete the transaction first, then worry about account management.
Payment Option Variety
Credit cards remain standard, but adding PayPal, Apple Pay, or other options removes barriers for people who prefer them.
International payment methods matter if you serve global customers. Some regions prefer bank transfers or local payment systems.
Display all accepted payment methods clearly on booking pages. Discovering you don’t accept their preferred method after filling out forms frustrates people.
Payment Options Priority:
| Method | Global Reach | Conversion Impact | Implementation Cost |
|---|---|---|---|
| Credit/debit cards | Essential | Baseline | Low |
| PayPal | High | 5-10% lift | Low |
| Apple Pay | Mobile users | 8-12% mobile lift | Medium |
| Google Pay | Android users | 6-10% mobile lift | Medium |
| Bank transfer | International | Regional necessity | Low |
| Local options (Alipay, etc.) | Regional | Critical for specific markets | Medium-High |
Transparent Pricing and Fees
Hidden fees appearing at checkout destroy trust. Show total costs upfront.
Break down pricing clearly. “Base tour: $2,000 | Park fees: $150 | Airport transfers: $100 | Total: $2,250” builds confidence.
Surprise expenses at checkout cause abandonment. Be transparent from the start.
Pricing Display Best Practices:
Show breakdown at initial search:
- Base price (always visible)
- Taxes (estimated)
- Fees (itemized)
- Total (bold, prominent)
On booking page, reiterate:
- Complete price breakdown
- What’s included vs. additional
- Cancellation policy costs
- Optional add-ons (clearly marked)
Mobile Booking Experience
Statista data shows desktop travel sites convert at 7.6% while mobile achieves only 2.6% in 2023. This represents a 3x conversion gap.
Additional mobile statistics from Scoop Market:
- 53% of mobile visitors abandon pages taking longer than 3 seconds to load
- One-second delay decreases mobile conversions by up to 20%
- 70% of mobile searches lead to action within an hour (vs. one month for desktop)
- 57% of users won’t recommend businesses with poorly designed mobile sites
- 61% of users unlikely to return to mobile sites they had trouble accessing
- Mobile shopping cart abandonment: 85.65% average
Large, thumb-friendly buttons prevent mis-taps. Auto-fill capabilities reduce typing on small screens.
Test your entire booking flow on actual phones. Desktop-optimized forms often break mobile experience.
Urgency and Scarcity Tactics
Urgency and scarcity trigger action when used honestly.
OptiMonk research shows conversion rates jump 332% with limited-time offers, and 60% of people say FOMO influences purchase decisions. Business2Community testing found countdown timers create an 8.6% conversion lift.
Fake tactics backfire by destroying trust.
Limited Availability Messaging
“Only 3 spots remaining for July departure” creates genuine urgency when true.
Real-time inventory updates show spots filling. “4 people are viewing this tour right now” socializes the decision.
Don’t fake scarcity. Getting caught lying destroys your reputation permanently.
Scarcity Messaging Performance:
CXL testing showed real-time stock levels increased conversion rates by up to 17.8% in high-traffic eCommerce stores.
OptiMonk data confirms:
- Limited-time offers: 332% conversion rate jump
- 60% of consumers say FOMO influences purchases
- Combining offers with scarcity increases effectiveness
Effective Scarcity Messages:
| Message Type | Conversion Impact | Trust Level | Best Use |
|---|---|---|---|
| “Only X spots left” | High (when true) | Must be accurate | Limited inventory |
| “X people viewing now” | Medium | Acceptable if real | Popular tours |
| “Last booked 2 hours ago” | Medium | Builds social proof | Active bookings |
| “Fills by [date] every year” | Low urgency, high trust | Historical data | Seasonal planning |
Countdown Timers for Deals
Visual countdown timers make deadlines concrete. “This price expires in 2 days, 14 hours” creates urgency.
Countdown Timer Effectiveness:
Research from multiple sources shows strong impact:
- Countdown timers increase conversions by 5-30% depending on audience (Zigpoll)
- 8.6% conversion lift from timer presence alone (De Nieuwe Zaak via Business2Community)
- 14.41% conversion rate for popups with countdown timers vs. 9.86% without (OptiMonk)
- Countdown timers with discounts boost sales up to 30% on Shopify stores (Best Colorful Socks)
- Experian reports urgency emails had 14% higher click-to-open rates and 59% higher transaction-to-click rates
OptinMonster case study: Cracku combined countdown timers with limited-time offers and increased conversions by 300%.
Use timers for legitimate promotions only. Constantly resetting “ending soon” timers train people to ignore you.
Make the consequence clear. “Book by [time] to lock in early-bird pricing. Regular rates apply after.”
Other Travelers Viewing Notifications
“12 travelers viewed this destination today” provides social proof and implies competition for availability.
This works when accurate. Made-up numbers feel manipulative when they don’t match reality.
Booking notifications (“Sarah from Austin just booked this tour”) demonstrate popularity and create FOMO.
Social Proof Notification Guidelines:
- Real-time data only (never fake)
- “X people viewing now” (live counter)
- “Booked Y times today” (actual bookings)
- “Z from [City] just booked” (recent conversions)
Combine with scarcity: CXL found showing stock levels with social proof increased conversions by 17.8%.
Seasonal Booking Windows
“Summer departures fill by February” sets expectations about booking timelines.
Peak season urgency is real. Communicating booking deadlines for popular times helps, not manipulates.
Off-season messaging can flip this. “Book September Italy tours now for lowest prices of the year.”
Seasonal Urgency Messaging:
Peak Season (Summer, Holidays):
- “Books 4-6 months in advance”
- “Only X departures remaining”
- Historical fill dates
- Waitlist availability
Shoulder Season:
- “Best availability now”
- “Lower prices than peak”
- Weather advantages
- Fewer crowds messaging
Off-Season:
- “Lowest prices of year”
- “Exclusive experiences”
- Local immersion opportunities
- “Book now, travel later” flexibility
Price Increase Alerts
Notify interested prospects about upcoming price increases. “Prices increase $200 on June 1st. Lock in current rates.”
This works for legitimate rate changes. Airlines do this constantly because it’s real.
Automated emails to people who viewed but didn’t book can recover conversions when price changes loom.
Price Increase Campaign:
2 Weeks Before:
- “Advance notice: Prices increasing [date]”
- Current vs. future pricing
- Savings calculation
1 Week Before:
- “Reminder: Price increase in 7 days”
- Urgency increases
- Specific savings amount
48 Hours Before:
- “Final chance: Prices increase in 2 days”
- Countdown timer
- Last opportunity messaging
Day Of:
- “Today only: Old pricing ends at midnight”
- Maximum urgency
- Clear deadline
Exit-Intent Strategies
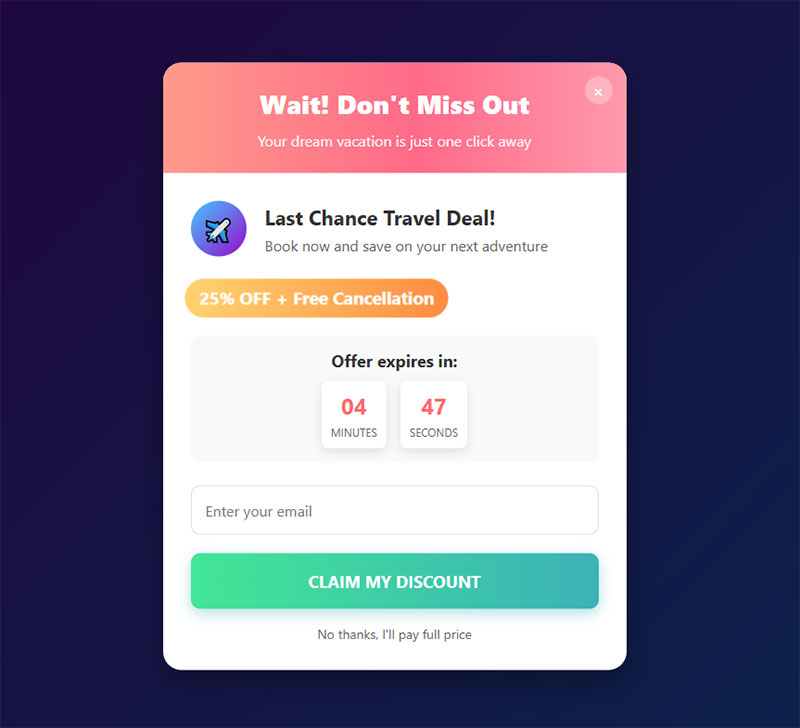
Someone’s about to leave without booking.
OptiMonk research shows cart abandonment popups achieve 17.12% average conversion rate, the highest of all popup types. Standard exit-intent popups convert 2-4% of abandoning visitors (OptinMonster).
Wisepops 2025 data reveals average popup conversion rate reached 4.65%, up from 4.01% in 2024. The top 10% of campaigns achieve 19.77% conversion rates.
Last-ditch efforts recover some of these almost-lost leads.
Last-Chance Offers
Exit popups offering small discounts can convert hesitant visitors. “$100 off if you book in the next hour” might tip the scales.
Exit-Intent Popup Performance:
According to GetSiteControl analysis:
- Exit-intent popups with discounts convert up to 7% of abandoning visitors into email subscribers
- Can save up to 13.5% of abandoned sales with checkout incentives
- Conversion Sciences estimates 10-15% of departing visitors can be recovered with well-crafted messages
OptinMonster case study: Shockbyte used exit popup with 50% discount and converted 13.73% of abandoning visitors, helping them grow business 10x in 3 years.
Don’t offer huge discounts that make people feel they overpaid if they’d booked earlier.
Test different offers to find what works without training visitors to always wait for exit discounts.
Help Chat Triggers
Exit-intent chat invitations offer assistance. “Have questions before you go? Chat with our travel specialist now.”
This provides a softer conversion attempt than aggressive discount popups.
Real humans respond better than bots for high-value travel inquiries.
Chat Trigger Strategy:
Immediate (0-10 seconds):
- Proactive greeting
- Low conversion intent
- Use: Homepage only
Mid-Session (30-60 seconds):
- Browsing specific destinations
- Medium intent
- Offer: “Questions about [Destination]?”
High-Intent (Booking page, 20+ seconds):
- Viewing prices, itineraries
- High intent
- Offer: “Ready to book? Chat for instant answers”
Exit-Intent:
- Mouse moves to close
- Last chance
- “Wait! Questions before you leave?”
Alternative Suggestions
“This tour sold out? Check out these similar options” keeps interested visitors engaged.
Recommend genuinely similar alternatives based on the destination or trip type they viewed.
Flexibility saves bookings when someone’s first choice isn’t available.
Recommendation Algorithm:
Match on:
- Destination region
- Trip duration
- Price range (+/- 20%)
- Activity type
- Travel style
Display:
- 3-4 alternatives maximum
- Clear comparison (vs. original)
- Available dates
- “Similar travelers booked” social proof
Email Capture Before Leaving
Minimum viable exit-intent popups just capture email addresses. “Get our free Bali planning guide before you go.”
WiserNotify research shows exit-intent popups without incentives convert at 5.10%, while adding discount or lead magnet raises this to 7.5-7.65%. However, they still underperform gamified popups (13% conversion) or cart abandonment popups (17.12%).
This converts browsers into leads even when they’re not ready to book now.
Follow up with nurture sequences bringing them back when timing is better.
Email Capture Offer Hierarchy:
High Value (7-10% conversion):
- Destination-specific guide
- Packing checklist
- “Insider tips” document
- Sample itinerary
Medium Value (5-7% conversion):
- General travel tips
- Newsletter with deals
- Blog content access
Low Value (3-5% conversion):
- Generic newsletter signup
- “Stay updated” messaging
Best Practice:
- Make offer specific to page viewed
- “Bali Guide” for someone viewing Bali tours
- Instant delivery
- No credit card required
Retargeting Pixel Implementation
Exit without conversion? Retargeting ads follow visitors across the web reminding them about your tours.
Install tracking pixels on all key pages. This enables targeting people who viewed specific destinations or packages.
Segment retargeting by behavior. Show different ads based on which pages someone viewed and for how long.
Retargeting Performance Benchmarks:
From earlier research:
- Retargeted users 43% more likely to convert than first-time visitors (Cropink)
- Retargeting achieves 3.8% median conversion rate vs. 1.5% prospecting (DemandSage)
- Average user sees ad 3.5 times before converting (NewswireJet)
- Performance drops past 6 views (frequency cap accordingly)
Platform Allocation:
- Facebook/Instagram: 40% (visual destinations)
- Google Display: 30% (wide reach)
- Google Search: 20% (high intent keywords)
- YouTube: 10% (video content)
Creative Strategy:
Image Ads:
- Destination hero image
- Price + urgency element
- Clear CTA
- Trust badge
Video Ads (15-30 seconds):
- Destination footage
- Customer testimonial clips
- Offer details
- Booking CTA
Dynamic Ads:
- Show exact tour viewed
- Current availability
- Real-time pricing
- Personalized messaging
FAQ on Lead Generation For Travel Companies
How long does it take to generate qualified travel leads?
Initial leads appear within days of launching campaigns, but qualified leads ready to book typically take 2-4 weeks. Travel decisions involve long consideration periods. Most travelers research for 45+ days before booking. Consistent marketing builds pipeline momentum over 60-90 days.
What’s the average cost per lead for travel companies?
Cost per lead varies dramatically by niche and channel. Budget travel generates leads at $5-15 each. Luxury travel leads cost $50-200. Google Ads typically runs $20-80 per lead. Organic content and email nurturing produce the lowest long-term costs once systems are established.
Which lead generation channel works best for travel businesses?
No single channel dominates. Google Ads captures high-intent searchers. Instagram and Facebook build awareness and inspiration. Email marketing nurtures relationships over long booking cycles. Successful travel companies use multi-channel approaches, tracking which sources generate actual bookings, not just inquiries.
How many form fields should travel lead capture forms include?
Top-of-funnel forms need just 2-3 fields maximum: name, email, and perhaps destination interest. Booking request forms can ask 6-10 questions since intent is higher. Multi-step forms feel less overwhelming than long single-page forms for detailed inquiries.
What conversion rate should travel websites aim for?
Travel site conversion rates (visitor to inquiry) typically range 1-3%. Premium positioning or niche specialization can achieve 4-6%. Booking conversion rates from inquiry to confirmed trip average 10-30% depending on follow-up quality, pricing, and service type. Track both metrics separately.
How do I generate leads without a big marketing budget?
Start with organic content targeting destination-specific searches. Build email lists through lead magnets like downloadable guides. Partner with complementary businesses for cross-promotion. Focus on past customer referrals. Optimize existing website traffic before spending on paid ads.
Should travel companies use chatbots for lead generation?
Chatbots handle basic qualification and after-hours coverage effectively. Complex trip planning needs human expertise. Use bots for initial engagement, FAQs, and routing qualified leads to sales team. High-value luxury or group bookings deserve immediate human interaction for best conversion rates.
What’s the best CRM for travel lead management?
HubSpot works well for small to mid-size operators. Salesforce scales for larger operations. Travel-specific platforms like TravelJoy or Travefy understand industry workflows. Choose based on your size, budget, and technical capabilities. Integration with booking systems and email platforms matters more than features.
How often should I follow up with travel leads?
Initial response within one hour dramatically improves conversion. Follow up again after 2 days, then weekly for active leads. Research-phase contacts need monthly nurture emails. Adjust frequency based on their timeline. Someone booking next month needs more touches than someone planning next year.
What information should I collect from travel leads?
Essential data includes destination interest, travel dates, budget range, and group size. Trip purpose (honeymoon, family vacation, business) helps personalization. Preferred communication method matters. Collect more details progressively rather than overwhelming with long initial forms. Past travel experience influences recommendations.
Conclusion
Effective lead generation for travel companies requires consistent effort across multiple channels. You can’t rely on a single tactic and expect sustained results.
Start with what you can control. Fix your website’s conversion issues, create valuable content, and build email nurture sequences that actually help prospects plan their trips.
Layer in paid channels once your foundation works. Google Ads and social media advertising accelerate results when your booking process already converts organic traffic well.
Track everything. Know which sources generate bookings, not just inquiries. Cost per booking matters more than cost per lead.
Test constantly. What works for luxury safari operators won’t work for budget Europe tours. Your audience determines which tactics succeed.
Most travel companies quit too early. Building a lead generation system that fills your calendar takes 3-6 months of consistent work. The companies that commit to the process stop worrying about empty booking calendars.
Your next customer is searching right now. Make sure they find you.