Most lead generation programs produce data. Few produce the right decisions from it. Knowing which lead generation KPIs to track is what separates teams that grow their pipeline with intention…
Table of contents
Most insurance agents spend more time chasing dead-end prospects than actually selling policies. The difference between agents who struggle and those pulling consistent six-figure commissions? Smart lead generation for insurance agents.
Your commission income depends entirely on your pipeline quality. Buying overpriced shared leads from QuoteWizard or EverQuote puts you in bidding wars with five other agents for the same prospect.
This guide shows you how to build predictable lead flow without burning through your marketing budget. You’ll learn which channels actually convert, how to set up systems that work while you sleep, and which metrics matter for tracking real ROI.
From optimizing your website forms to building referral programs that scale, these strategies work for independent agents and captive agents alike. Time to stop hoping for leads and start generating them.
Understanding Lead Generation Basics for Insurance
What Makes Insurance Lead Generation Different
Insurance sales leads behave differently than other industries. The decision to buy a policy takes weeks or months, not hours.
EverQuote research shows the average insurance sale happens one to three weeks after initial contact. A recommended 21-day sales cycle includes 8-10 touches with the client. Commercial insurance deals range from 3 days to 18 months depending on complexity.
People don’t wake up excited about shopping for coverage. They need it, sure, but handing over personal financial details requires trust that takes time to build.
State regulations limit how agents can market themselves. What works for selling shoes online might violate insurance advertising rules in your state.
Policy sales justify higher acquisition costs because clients stick around for years. Industry data shows:
- Average customer retention rate: 84% across insurance
- Top agencies maintain 93-95% retention
- A 5% improvement in retention can double profits in five years
A single life insurance client with $20,000 annual premiums at 15% commission generates $3,000 per year. According to Advisorist, keeping that client for five years creates $14,500 in lifetime value after $500 acquisition costs.
That math changes everything about how you approach lead generation.
Types of Leads Worth Pursuing
Referrals from current policyholders convert at dramatically higher rates. According to Marketo, referral conversion rate hits nearly 11%, at least 4x higher than other marketing channels.
NIP Group data shows referred leads close at 60% versus 15% for non-referred prospects. That’s 4x the conversion rate.
Businesses using referral programs report 71% higher conversion rates overall, according to BBSI research. Referred customers also show 37% higher retention than non-referred customers.
Someone fills out your website form asking for quotes? That’s an inbound lead who’s actively shopping. They’re comparing you against three other agents right now.
Paid leads from companies like SmartFinancial or EverQuote can work. But you’re often competing with five other agents for the same prospect.
Lead type pricing breakdown:
| Lead Type | Cost Range | Competition | Notes |
|---|---|---|---|
| Exclusive real-time | $75-200+ | None | Highest conversion potential |
| Shared leads | $10-40 | 4-8 agents | Distributed to multiple buyers |
| Aged leads (30+ days) | $0.75-15 | Varies | Lower conversion, higher volume |
Life event triggers matter more than demographics. New homeowners need coverage immediately. People getting married start thinking about life insurance.
Facebook knows when someone changes their relationship status. Google knows when they search “how much life insurance do I need.”
Quality Over Quantity Mindset
Ten qualified prospects beat 100 tire kickers every time.
The data proves it. Cold leads convert at less than 2% according to Profitise research. Meanwhile, exclusive leads with proper follow-up hit 15-20% conversion rates. Aged leads worked consistently can convert around 10%.
Response time matters enormously. Velocify research shows responding within one minute increases conversion rates by 391%. Leads contacted within five minutes are 21x more likely to convert than those called after 30 minutes.
Harvard Business Review found that 78% of buyers go with the first company that responds. Yet the average business takes 47 hours to respond to leads.
Someone who clicks “get quote” while watching Netflix at 2am isn’t the same as someone whose mortgage lender requires proof of homeowners insurance by Friday.
Cost per lead tells you nothing without conversion data. Spending $15 per lead sounds cheap until you realize your close rate is 2%.
Meanwhile, referral leads might cost $100 each in incentive payments but convert at 4x the rate. Do that math.
Lead ROI calculation example:
| Metric | Shared Lead | Referral Lead |
|---|---|---|
| Cost per lead | $20 | $100 |
| Conversion rate | 2% | 25% |
| Leads needed for 1 sale | 50 | 4 |
| Cost per sale | $1,000 | $400 |
Track your numbers by source. Not just where leads come from, but which sources produce clients who stick around and buy additional policies later.
Agentero data shows increasing average policies per customer to more than 1.8 reduces annual churn rates to just 5% (95% retention).
Building Your Digital Foundation
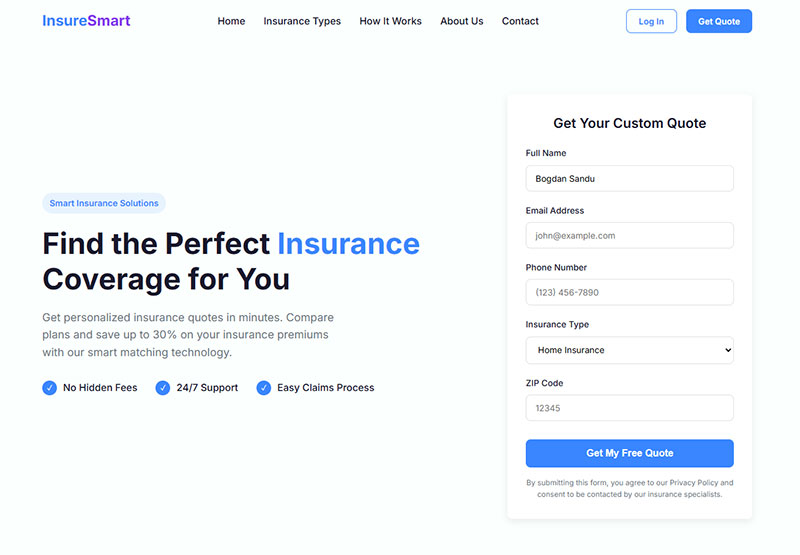
Website Essentials That Actually Convert
Your homepage has three seconds to answer: “Why should I care?”
Actually, it’s even tighter. Attention spans dropped from 2.5 minutes in 2004 to just 47 seconds in 2024, according to research from Sender. Every element must earn its place.
Skip the stock photos of diverse people shaking hands. Lead with what makes you different. “Saved 47 local families an average of $830 on home and auto bundles” beats generic trust language.
Quote request forms shouldn’t require 15 fields. Name, email, phone, and coverage type. That’s it for the first step.
Research from Neil Patel shows forms with 3 fields convert at 25%, while 6+ fields drop to just 15%. Imagescape increased conversions by 120% by reducing form fields from 11 to 4.
Progressive profiling lets you gather more details after the initial contact. People abandon forms that feel like a DMV application.
Mobile traffic accounts for 59% of all web traffic now, according to DesignRush data. If your site loads slowly or looks broken on phones, you’re done.
Page speed directly impacts conversions:
| Load Time | Effect on Conversions |
|---|---|
| 1 second | 3x higher conversion than 5-second sites |
| 2 seconds | 47% of customers expect this or faster |
| 3+ seconds | 53% of mobile visitors leave |
Trust signals belong above the fold. Your license number, years in business, carriers you represent, and Google reviews. Make them visible immediately.
According to Unbounce, insurance websites lead all financial services with an 18.2% conversion rate, outperforming the sector median by 119%. But only if you nail the fundamentals.
Landing Pages That Work
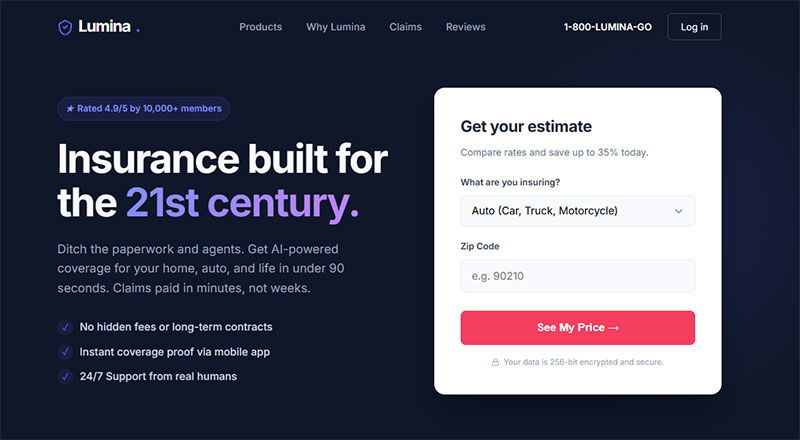
Each ad campaign needs its own landing page. Someone searching “cheap car insurance Phoenix” expects Arizona-specific content, not your generic homepage.
Remove your navigation menu. Every link off the page is an exit opportunity.
UserGuiding research confirms that removing navigation menus can double your conversion rate. Landing pages with a single CTA convert at 13.5% on average, compared to 10.5% for pages with five or more links.
Your headline should match the ad they clicked. If the ad promised “instant quote,” the landing page better deliver an instant quote.
Call-to-action buttons perform better when they say what happens next. HubSpot research shows personalized CTAs convert 202% better than generic versions.
CTA text matters:
- Using “Submit” decreases conversions by 3%
- Action words like “Get My Quote” outperform vague CTAs by 20-30%
- First-person phrasing (“Get My Quote” vs “Get Your Quote”) often lifts conversions
One focus per page. Auto insurance or life insurance, not both. Pick one goal and eliminate everything else.
I test landing pages against each other constantly. Sometimes the version I think will win loses badly. Your opinion doesn’t matter, conversion data does.
Only 1 in 8 landing page A/B tests achieve significant changes, according to Hostinger research. Keep testing anyway.
Contact Forms and Lead Capture
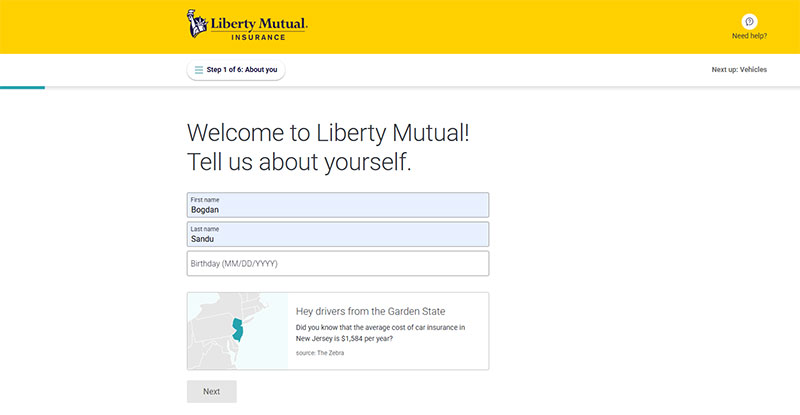
Multi-step forms convert better than single-page forms for insurance. Breaking questions across 3-4 screens feels less overwhelming.
HubSpot reports multi-step forms convert 86% higher than single-step forms. BrokerNotes saw their financial lead conversion rate jump from 11% to 46% after switching.
Venture Harbour documented even larger gains. A consulting inquiry form went from 0.96% to 8.1% conversion (743% increase) by using multi-step design.
Start with the easiest question. “What type of coverage are you looking for?” with big clickable buttons beats asking for their name first.
Make your form fields obvious and accessible. Following basic form accessibility principles isn’t just good practice, it’s often legally required.
Exit-intent popups work when someone’s about to leave. Offer something valuable. “Download our Home Insurance Checklist” captures emails from people who weren’t ready to get a quote yet.
Exit popup benchmarks:
| Popup Type | Average Conversion Rate |
|---|---|
| Cart abandonment | 17.12% |
| Lucky wheel/gamified | 13.23% |
| Email with incentive | 7.5-7.65% |
| Email without incentive | 5.10% |
According to OptiMonk data, exit popups recover 10-15% of abandoning visitors when the offer is well-crafted. The average popup conversion rate was 11% in 2024.
Live chat tools like Drift catch people with quick questions. “Do you cover flood damage?” shouldn’t require filling out a form.
LSA research shows 78% of insurance consumers call a business after running a search. Phone calls convert 10-15x more revenue than web leads, according to BIA/Kelsey data.
AgencyBloc and similar CRMs integrate directly with WordPress forms to push leads into your pipeline automatically.
Content Marketing for Insurance Agents
Blog Topics That Generate Leads
Write about what people actually search for. “How much life insurance do I need for a mortgage” gets thousands of monthly searches.
This approach works. According to BKA Content research, companies that post regular blogs receive 97% more customer leads than brands that don’t engage with customers online.
Coverage mistakes make great content. “5 Things Your Auto Insurance Doesn’t Cover” teaches and positions you as the expert who prevents problems.
61% of consumers say they feel greater trust in and are more likely to buy from insurance companies that provide custom online content, according to IA Magazine research.
Local angles work brilliantly. “Hurricane Preparedness Checklist for Tampa Homeowners” targets a specific audience with specific needs.
Google confirms that mobile queries containing “insurance near me” have grown by over 100% in the past two years. Local content captures these searchers.
Life event content captures people at decision points. Articles about insurance for new parents, first-time homebuyers, or small business owners hit readers when they’re actively shopping for policies.
Don’t avoid policy comparisons. Someone searching “term life vs whole life” wants education, not a sales pitch. Give them the honest comparison.
78% of clients feel that brands releasing custom content are interested in building good relationships, not just making sales.
I rank for dozens of long-tail keywords through comprehensive guides. Google rewards thorough content that answers the complete question.
Video Content Strategies
Three-minute explainer videos outperform text for complex policy details. Recording yourself explaining umbrella insurance creates connection that blog posts can’t match.
The data supports this. According to Wyzowl, 91% of businesses now use video as a marketing tool, and 86% of marketers report that video content increased their conversion rates.
Adding video to landing pages can boost conversion rates by up to 80%, according to WebFX research.
Client testimonials on video feel authentic when they’re slightly imperfect. Professional studio production actually reduces trust sometimes.
Video testimonial impact:
| Metric | Effect |
|---|---|
| Viewer purchase likelihood | 64% more likely after watching |
| Brand trust increase | 72% trust more with positive testimonials |
| Conversion rate boost | Up to 25% increase |
| Recall vs written reviews | 2.1x more memorable |
According to Famewall research, 90% of people trust customer testimonials more than what a company says about itself. Trustmary data shows a single testimonial video on a checkout page drove a 32% increase in sales.
FAQ videos address objections before they happen. “Why is my auto insurance so expensive?” answered on video saves you from repeating the same conversation 50 times.
Behind-the-scenes content humanizes you. Show your office, introduce your team, talk about why you became an agent. Boring to you, interesting to prospects who want to know who they’re working with.
Post these on YouTube, Facebook, and your website. Each platform has different audiences, and video content gets prioritized in search results now.
Wistia research shows 67% of businesses point to their own website as the best place to distribute videos, followed by email at 49% and LinkedIn at 43%.
Video length benchmarks:
| Duration | Best Use Case |
|---|---|
| Under 1 minute | Social media clips, quick tips |
| 1-3 minutes | Explainer videos, FAQs |
| 5-30 minutes | Educational content (11% conversion rate) |
| 60+ minutes | Webinars (13% conversion rate) |
Lead Magnets and Downloadables
Coverage checklists work because they’re immediately useful. “New Homeowner Insurance Checklist” gives value before asking for anything.
GetResponse research shows 58.6% of marketers say short-form written content (checklists, newsletters, samples) delivers the highest conversion rates. Long-form content like guides and reports works best for 41.4%.
Lead magnet conversion benchmarks:
| Type | Average Conversion Rate |
|---|---|
| Cheat sheets | ~34% |
| Interactive quizzes/calculators | ~70% |
| Webinars | ~70.2% |
| Ebooks (relevant to audience) | 20-28% |
| Average landing page | ~18% |
Adding a lead magnet to popup forms raises mobile conversion from 3.8% to 7.7%, a 100% lift according to recent studies.
Creating effective lead capture forms means balancing information requests with conversion rates. Ask for too much, nobody fills it out.
Policy comparison spreadsheets let people do their own research while staying engaged with your brand. Template it in Google Sheets where they can make a copy.
Local disaster prep guides work great for agents in areas with specific risks. Florida agents write hurricane guides, California agents write earthquake guides.
Interactive calculators keep people on your site longer. “How much life insurance do I need?” calculators collect email addresses while providing genuine value.
Interactive content boosts conversions by 70% compared to passive content like standard PDFs.
ROI tracking matters here. Which lead magnets generate actual clients, not just email signups? Some downloads attract people who’ll never buy.
53% of entrepreneurs use lead magnets to generate leads, and 44.3% report this method delivers the best ROI according to Claspo research.
Social Media Lead Generation Tactics
Facebook and Instagram Approaches
Life event targeting is where Facebook ads shine for insurance agents. The platform knows when someone gets engaged, buys a house, or has a baby.
Target people who recently moved within 30 miles of your office. New residents need to establish local relationships, including insurance coverage.
Local community groups on Facebook require participation, not just promotion. Answer questions about coverage without immediately pitching your services.
Educational posts outperform sales posts by massive margins. “3 things your renters insurance actually covers” gets shared. “Call me for a quote” gets ignored.
Stories and Reels show personality that static posts can’t match. Quick tips, client questions, or explaining why rates increased this year all work.
According to Sprout Social, Instagram Reels from influencers see a 2.08% engagement rate, the highest among all post types on the platform. Carousel posts trail at 1.7%, while static photos get just 1.17%.
For smaller accounts, the numbers are even better. A Metricool study found accounts with under 5,000 followers achieve a 20% Reel view rate, dropping to around 10% for mid-sized accounts (5k-50k).
Facebook Lead Ads capture information without sending people to your website. The form is pre-filled with their Facebook data, reducing friction significantly.
WordStream research shows Lead Ads convert at 12.54% on average across industries, compared to 4.3% for standard landing pages. The trade-off: landing page leads convert to qualified opportunities at a 5.7% higher rate because they require more effort to submit.
For insurance specifically, WordStream’s 2024 benchmarks show the Finance & Insurance industry has:
- Average CPC: $4.57 (lead gen campaigns)
- Average CPL: $21.98
- CTR: 0.88% (lower than most industries due to complex buying decisions)
Just remember, these leads need immediate follow-up. Someone who filled out a form while scrolling in line at Starbucks forgets about it in 20 minutes.
Facebook Ad Performance Quick Reference
| Metric | Finance/Insurance Average | All Industry Average |
|---|---|---|
| CTR (Lead Ads) | 0.88% | 2.50% |
| CPC (Lead Ads) | $4.57 | $1.88 |
| Conversion Rate | 8.78% | 8.78% |
| Cost Per Lead | $21.98 | $21.98 |
Source: WordStream 2024 Facebook Ads Benchmarks
LinkedIn for Commercial Insurance
Business owners hang out on LinkedIn, not Facebook. If you sell commercial policies, this is where you need to be.
HubSpot research shows LinkedIn delivers 2x higher conversion rates than Facebook and Twitter combined. According to Sprout Social, 40% of B2B marketers rate LinkedIn as the most effective channel for driving high-quality leads.
The numbers back this up. LinkedIn’s visitor-to-lead conversion rate is 2.74%, nearly three times higher than other social platforms. And LinkedIn generates 277% more leads than Facebook and Twitter combined for B2B, according to Foundation Marketing.
Publishing articles about business insurance mistakes positions you as someone worth knowing. Write about actual client situations (anonymized, obviously).
Content that works on LinkedIn:
- Industry insights and thought leadership
- Behind-the-scenes of claims you’ve helped resolve
- Business owner success stories (with permission)
- Regulatory changes affecting local businesses
Join local business groups and chambers of commerce that have LinkedIn presences. Contribute genuinely useful information.
Direct outreach works when it’s personalized and not pushy. “I noticed your construction company just landed the Main Street project. Congrats. Have you reviewed your liability coverage lately?” beats generic connection requests.
LinkedIn data shows InMail messages get a 3x higher response rate than standard email outreach. The key is relevance and timing.
Share wins publicly. “Helped a local restaurant owner save $4,200 on their commercial policy while improving coverage” demonstrates value.
LinkedIn Sales Navigator costs money but filters prospects by company size, industry, and job title. A Forrester study found companies using Sales Navigator see a 312% ROI over three years and a 17% higher win rate than traditional prospecting tools. Worth it if commercial insurance is your focus.
Engagement Strategies That Convert
Respond to comments within an hour if possible. Social media rewards quick engagement with better reach.
Zendesk research found that response times over one hour result in a 15% drop in customer satisfaction. Meanwhile, Amra & Elma reports 73% of users expect brands to respond within 24 hours on social platforms.
Ask questions that start conversations. “What’s the most confusing part of your auto insurance policy?” gets dozens of answers and each response is a potential lead.
Interactive content drives engagement:
- Polls identify prospects without feeling salesy
- Q&A sessions build trust and authority
- Quizzes can reveal coverage gaps
“How often do you review your life insurance coverage?” with answer options reveals who’s thinking about their policies. Use this data to prioritize follow-up.
User-generated content builds trust faster than anything you post yourself. Share client reviews, testimonials, and success stories (with permission).
According to EnTribe research, 84% of people are more likely to trust a brand that uses user-generated content in their marketing. Bazaarvoice found that UGC-based ads get 4x higher click-through rates than traditional ads.
More data from Nosto: consumers find UGC 9.8x more impactful than influencer content when making purchasing decisions. For insurance, where trust is everything, this matters.
Don’t automate everything. Scheduled posts are fine, but real-time engagement matters. Comment on local news, congratulate business milestones, show up as a human.
Email Marketing for Insurance Leads
Building Your Email List
Website signup incentives need to offer real value. “Insurance tips” is too vague. “2024 Home Insurance Rate Changes in [Your City]” works.
Every networking event should result in follow-up emails. “Great meeting you at the Chamber breakfast. Here’s that article about LLC insurance I mentioned.”
Current clients should all be on your newsletter list. Cross-selling opportunities live in regular communication.
Partner lists expand your reach. Real estate agents, mortgage brokers, and financial advisors all have audiences who need insurance.
Registration forms on your site should be simple and explain exactly what people get. “Weekly insurance tips” or “Monthly coverage updates,” not just “Subscribe.”
Never buy email lists. Deliverability tanks, unsubscribe rates spike, and you might violate CAN-SPAM regulations.
Email Sequences That Nurture Leads
Welcome emails set expectations immediately. Send within five minutes of signup. Introduce yourself, explain what they’ll receive, and offer one piece of immediate value.
GetResponse data shows welcome emails achieve an 83.63% open rate and 16.60% click-through rate. That’s roughly 4x higher opens and 5x higher clicks than standard marketing emails.
According to Invesp, welcome emails generate 320% more revenue per email than promotional messages. And 74% of subscribers expect a welcome email immediately after signing up. Miss that window and you’ve lost momentum.
Educational drip campaigns work over weeks, not days:
- Email one: Types of coverage
- Email two: Common policy gaps
- Email three: How to review your current policies
Omnisend research found that automated email sequences deliver 2,361% higher conversion rates than one-off campaigns. A three-email welcome series can generate 90% more orders than sending just one message.
Re-engagement sequences target people who haven’t responded in months. “Still looking for coverage?” with a specific offer or updated quote pulls some back.
Birthday emails remind clients you exist. “Time to review your coverage for the year ahead” tied to their birthday feels personal.
Anniversary emails celebrate the relationship. “You’ve been with us for three years. Here’s how your coverage has protected you.”
Policy renewal reminders start 60 days early. Don’t assume clients remember when their coverage expires.
Email Content That Gets Opens
Subject lines need curiosity without clickbait. “Your auto rates are going up (here’s why)” tells them what’s inside and why they should care.
Campaign Monitor research shows personalized subject lines boost open rates by 26%. Beyond first names, reference their coverage type, renewal date, or previous conversations.
Personalization drives real results:
- 29% higher open rates and 41% higher click-through rates for personalized emails
- Personalized CTAs convert 202% better than generic ones (HubSpot)
- Companies using personalization earn 40% more revenue than competitors who don’t
Mobile formatting isn’t optional anymore.
AudiencePoint estimates 50-60% of emails are opened on mobile devices in 2024. Campaign Monitor found that 81% of all emails are read on mobile.
Keep paragraphs short, images small, and buttons tappable.
One clear call-to-action per email. Schedule a review, download a guide, or reply with questions.
HubSpot data shows emails with a single CTA can increase clicks by up to 371%. Multiple asks reduce response rates.
Test send times for your audience. Insurance agents often find Tuesday through Thursday mornings work best, but your list might behave differently.
GetResponse data shows emails sent once per month have the highest open rates at 28%, while 2-4 times monthly averages 21%.
Plain text emails sometimes outperform designed templates. They feel personal, like you wrote directly to that person.
Email Performance Benchmarks
| Email Type | Open Rate | Click Rate | Revenue Impact |
|---|---|---|---|
| Welcome emails | 83.63% | 16.60% | 320% more per email |
| Automated sequences | 45.38% | 5.02% | 2,361% higher conversion |
| Standard newsletters | 40.08% | 3.84% | Baseline |
| Re-engagement | 29%+ | Varies | Recovers inactive leads |
Sources: GetResponse 2024, Omnisend, Invesp
Key Metrics to Track
| Metric | Good Benchmark | Action If Below |
|---|---|---|
| Open rate | 39-42% | Test subject lines, clean list |
| Click-through rate | 2-5% | Improve CTA, content relevance |
| Click-to-open rate | 5.3%+ | Better content-to-subject match |
| Unsubscribe rate | Under 0.5% | Reduce frequency, segment better |
| Bounce rate | Under 2% | Clean list, verify addresses |
Sources: Constant Contact, MailerLite, GetResponse 2024
Paid Advertising Strategies
Google Ads for Insurance Agents
High-intent keywords convert immediately. “car insurance quote phoenix” means someone’s ready to buy, not just browsing.
The insurance industry has one of the highest CPCs across all verticals. WebFX reports that insurance keywords average $67.73 CPC in 2025, making strategic keyword selection critical for ROI.
Google Local Services Ads put you at the top with a green verified checkmark. You pay per lead, not per click, and Google screens them first.
LSA costs range from $6 to $30 per lead for most industries, according to PrimeLSA data. Financial planners typically spend $98-$147 monthly for 10 leads in competitive markets.
Search ads need tight local targeting. Someone in Tampa searching for insurance shouldn’t see your ad if you’re licensed in Phoenix.
Negative keywords save wasted budget. Add “jobs,” “careers,” “salary,” and insurance company names you don’t represent.
Ad extensions increase click-through rates by 15-20%. Location, call buttons, and sitelinks all make your ad more useful.
Your landing page needs to match the ad promise exactly. Search for “home insurance quote,” see “home insurance quote” in the headline.
Quality Score affects how much you pay per click. Relevant ads, good landing pages, and high click-through rates all improve it.
Growth-onomics research shows that increasing Quality Score from 5 to 8 can cut your CPC by roughly 30%. A utility billing company saved an estimated $632K in one year from Quality Score improvements alone, according to a case study from (un)Common Logic.
WordStream analysis found that for every Quality Score point above average, CPA drops by approximately 16%.
| Quality Score | CPC Impact |
|---|---|
| 10 | 50% discount vs. average |
| 8 | 30% savings |
| 6 | 17% savings |
| Below 5 | Pay up to 64% premium |
Facebook and Instagram Ads
Lookalike audiences from your current clients find people similar to your best customers. Facebook’s algorithm matches demographics, interests, and behaviors.
Lebesgue’s research shows that lookalike audiences deliver the highest conversion rates and lowest CPC compared to interest-based or broad targeting. However, expect 45% higher CPM than broad targeting.
Focus Digital data indicates lookalike audiences based on existing customer data outperform interest-based targeting by 35%.
Retargeting website visitors costs less and converts better than cold traffic. Someone who visited your life insurance page sees ads about life insurance for the next 30 days.
Cropink reports that retargeting campaigns achieve conversion rates 367% higher than cold audience campaigns. Retargeted users are 3x more likely to engage with an ad compared to cold audiences.
One agency case study showed 5-6% conversion rates with retargeting versus 2.5-4% with cold audiences, and cost per sale dropped by £1-£2.
Lead form ads work better on mobile because they don’t require leaving Facebook. Contact forms built for mobile reduce abandonment significantly.
Video ads cost more to produce but often deliver lower cost-per-lead. A 30-second explainer about why rates went up gets attention that static images don’t.
A Biteable experiment found video ads were 497% cheaper per click and 280% cheaper per lead than image ads. Video cost $2.75 per lead compared to $14.22 for images.
However, Confect.io’s analysis of 12 billion impressions found video ads have a 24% higher cost per purchase than images for top-of-funnel campaigns. For remarketing, video edges out images by only 3%.
Use video for:
- Brand awareness and engagement (612% more likes and comments)
- Retargeting warm audiences
Use images for:
- Direct conversion campaigns
- Limited budgets
Budget allocation should favor what’s working. Start with $10/day per campaign, then shift money toward winners after a week of data.
Ad fatigue happens faster on social platforms. Refresh creative every two weeks or watch your cost-per-click climb.
Meta’s 2024 Ad Performance Report shows campaigns experience a 41% drop in CTR after users see an ad more than four times. DashClicks research confirms that advertisers who refresh creatives every 10-14 days maintain up to 30% higher engagement than those running the same visuals for a month.
Ad Fatigue Warning Signs:
- CTR decreasing while CPM stays consistent
- Frequency rising above 2.5-3.0
- Rising cost per conversion
- ROAS plateauing without budget changes
TikTok recommends refreshing creatives every 7 days. Meta ads typically last 2-4 weeks before fatigue sets in.
Managing Ad Spend Effectively
Start small with $500-1000 monthly budget split across campaigns. Scale what converts, pause what doesn’t.
A/B test one element at a time. New headline versus old headline, not completely different ads. Otherwise you can’t identify what made the difference.
Pause underperforming campaigns after spending 3x your target cost-per-lead with no conversions. Some channels just won’t work for your market.
Conversion tracking must be set up correctly. If you can’t measure which ads produce clients, you’re flying blind.
Search Engine Land recommends insurance brokers set a 7-day conversion window for quote requests and a 90-day window for policy purchases to accurately capture the full sales cycle.
Attribution gets messy because people rarely buy immediately. Someone might see your Facebook ad, then Google your name, then fill out your website form three days later.
Google’s default lookback window is 7 days for clicks. For industries with longer sales cycles like insurance, extend this to 30-90 days to capture all touchpoints.
Track phone calls, form submissions, and email replies separately. Different lead sources behave differently through your sales funnel.
Cost per policy sale matters more than cost per lead. A $50 lead that converts at 30% is better than a $20 lead that converts at 5%.
| Metric | What It Tells You | Action Threshold |
|---|---|---|
| Cost Per Lead | Campaign efficiency | Pause at 3x target with no conversions |
| Lead-to-Sale Rate | Traffic quality | Below 15%: review targeting |
| Cost Per Policy | True ROI | Compare across all channels |
| Quality Score | Ad relevance | Below 5: optimize landing pages |
| Ad Frequency | Fatigue risk | Above 3.0: refresh creative |
Quick Reference: Platform Benchmarks (Finance/Insurance)
| Platform | Avg CPC | Avg CPL | Avg Conversion Rate |
|---|---|---|---|
| Google Search | $4.57 | $21.98 | 2.78% |
| Google LSA | N/A (pay per lead) | $6-$30 | Pre-qualified |
| Facebook Lead Ads | $1.88 | $21.98 | 8.95% avg |
| Facebook Traffic | $0.72 | Higher | Varies |
Referral Systems That Scale
Making Referrals Easy for Clients
Ask right after you’ve delivered value. Policy just saved them $600? That’s when you request introductions to friends who might need coverage.
Timing matters more than you think. Buyapowa’s 2024 study found the number one moment customers are most receptive to referral requests is immediately after interacting with customer support. After positive experiences, 35% of customers are also open to learning about referral programs.
Yet there’s a massive opportunity gap. Firework research shows 83% of consumers are willing to refer a brand, but only 29% actually do. Dale Carnegie data reveals that 91% of customers would give referrals, but only 11% of salespeople ask.
Physical referral cards feel old-school but work. Hand clients five cards with your contact info and a “Referred by [Client Name]” space.
Digital referral links through text or email make sharing effortless. “Forward this to anyone shopping for insurance” with a trackable URL shows exactly who sent what.
Firework reports that incentives can increase referral activity by up to 25%. Simple, accessible tools like shareable links improve engagement significantly.
Incentive structures need clear rules. “$50 gift card for every referral who gets a quote” or “donate $100 to their chosen charity for every policy sold.”
Double-sided rewards work best. Impact.com data shows that 91.2% of all referral programs offer incentives to both the referrer and the new client.
Thank referrers within 24 hours regardless of whether the lead converts. Acknowledging the effort matters more than the outcome.
Don’t ask too often. Once or twice per year unless a specific opportunity arises naturally in conversation.
Partner and Business Referrals
Real estate agents need insurance agents who respond fast. Their clients need coverage before closing dates, and delays kill deals.
Freddie Mac research shows 76% of homebuyers choose their mortgage provider based on recommendations from their real estate agent. The same trust transfers to insurance referrals.
According to NAR data, 88% of home purchases involve a real estate agent or broker. Position yourself as their go-to insurance resource.
Mortgage brokers send pre-approved buyers who must get homeowners insurance. These referrals convert at 60%+ because coverage isn’t optional.
Mike DelPrete’s 2025 analysis shows 87% of mortgage business comes from referrals and past clients. Poland’s second-largest mortgage broker, Lendi, reports 60% of transactions originate from loan officer referral networks.
Financial advisors complement your services perfectly. They handle investments, you handle risk protection, and clients benefit from coordinated strategies.
AD Mortgage identifies the top five referral sources for mortgage professionals: past clients and real estate agents (both at 84%), friends and family (58%), financial advisors/CPAs (21%), and builders (21%).
Local business cross-promotion expands both audiences. Coffee shop puts your cards by the register, you display their gift certificates in your office.
Partnership agreements should be informal but clear. How will you share leads? What’s the referral process? Who handles what?
Exclusive relationships work better than spreading yourself thin across ten partners. Find two or three quality referral sources and nurture those relationships hard.
Referral Tracking and Follow-Up
CRM tagging identifies which partners send the best leads. Salesforce or AgencyBloc both allow custom fields for referral sources.
GetApp research shows 71% of CRM users rate referral tracking as important or highly important for customer acquisition and lead management.
Close the loop with referrers every time. “Your friend John just saved $400 on his auto policy. Thanks for the introduction.”
Conversion rates by referral source reveal who’s sending tire kickers versus real prospects. Track this monthly.
The numbers prove the value. According to SaaSQuatch, referred leads have a 30% higher conversion rate than leads from other channels. Annex Cloud data shows referral marketing generates 3-5x higher conversion rates than any other channel.
Adjust incentives based on results. Partners sending high-quality leads deserve better compensation than those sending random contacts.
Quarterly check-ins with major referral partners keep relationships strong. Lunch meetings, coffee catch-ups, or quick phone calls maintain momentum.
Stop wasting effort on partners who never send anyone. Some relationships sound good but produce nothing.
Why Referrals Deliver Higher ROI
| Metric | Referred vs. Non-Referred |
|---|---|
| Conversion rate | 30% higher |
| Retention rate | 37% higher |
| Lifetime value | 16-25% higher |
| Profit margins | 25% higher |
| Churn rate | 18% lower |
| Loyalty | 18% more loyal |
According to Harvard Business Review, referred customers have a 16% higher lifetime value. Wharton School research confirms a 37% higher retention rate and 25% higher profit margins from referred customers.
Prefinery’s 2024 analysis found referred customers are 4x more likely to refer others, creating a self-sustaining cycle.
Key Referral Metrics to Track:
- Participation rate: Aim for 5-9% of customers actively referring
- Conversion rate: Target 2-3x your normal conversion rate
- Referral revenue: As % of total revenue (benchmark: 2-10%)
- Cost per acquisition: Compare to paid channels
The global average referral rate is 2.35%. Top performers reach 20%+. Branch Basics generated over $1.5 million from their referral program, with 10% of total revenue from referrals.
Local Marketing Techniques
Google Business Profile Optimization
Complete every section of your profile. Hours, services, description, attributes, and especially photos of your actual office.
According to Google, profiles with photos receive 42% more requests for directions and 35% more website clicks than those without. Birdeye’s 2024 analysis found that profiles with 15+ photos saw stronger engagement across all customer actions.
Client reviews influence both search rankings and conversion rates. Request reviews immediately after positive interactions.
Whitespark’s 2024 Local Ranking Factors Survey shows reviews now make up 16% of local pack rankings. WebFX research found listings tend to rank higher once they hit 10 reviews. Localo’s analysis of 2 million profiles revealed businesses with 200+ reviews are more likely to appear in the top three search positions.
| Review Count | Average Search Position |
|---|---|
| 200+ reviews | Top 3 positions |
| Under 200 | Positions 4-10 |
| Under 150 | Positions 11-20 |
Post updates weekly. Market changes, coverage tips, local events you’re attending, or team highlights all work.
Q&A sections fill with questions whether you answer them or not. Monitor and respond to control the narrative.
Local SEO depends heavily on consistent NAP (name, address, phone) across directories. Inconsistencies confuse Google and hurt rankings.
According to Whitespark’s expert survey, choosing the wrong primary category is the #1 negative ranking factor for local SEO. GBP signals now account for over 32% of local pack rankings, more than reviews, links, or on-page content.
Photos matter more than most agents realize. Inside your office, team headshots, community involvement, and even your parking lot help people feel familiar before meeting you.
BrightLocal’s 2025 survey shows 81% of consumers use Google for reading reviews about local businesses. Chatmeter’s December 2024 survey found 52% of consumers look for at least a 4-star rating and 51% want to see photos in reviews before choosing a business.
GBP Optimization Checklist:
- Add 15+ high-quality photos (interior, exterior, team, parking)
- Request reviews after positive interactions
- Respond to all reviews (140+ word responses correlate with higher rankings according to Localo)
- Post weekly updates
- Monitor and answer Q&A section
- Verify NAP consistency across all directories
- Select correct primary category
Community Involvement for Leads
Sponsor Little League teams or local 5K races. Your banner at games keeps your name visible to hundreds of families over months.
Speaking at Rotary clubs, chambers of commerce, or HOA meetings positions you as the local expert. Offer educational talks, not sales pitches.
Event sponsorship works. According to Kantar research, most sponsorship programs deliver strong ROI when they include well-coordinated activation plans. The long-term effects from sponsorship programs are often greater than the direct or immediate effects.
Host insurance workshops at libraries or community centers. “Understanding Medicare Options” or “First-Time Homebuyer Insurance Guide” attract specific audiences.
Chamber membership costs money but provides weekly networking opportunities. Show up consistently, not just when you need something.
Volunteer at community events. The guy handing out water at the charity run becomes a familiar face, not just another insurance agent.
BrightLocal’s 2025 research found nearly half (46%) of US adults turn to local news outlets as sources for local business reviews. Community engagement and local visibility translate directly to consumer trust.
Local sponsorships work best when aligned with your values. Supporting causes you actually care about comes across as genuine.
Community Involvement Tracker:
| Activity | Frequency | Estimated Reach |
|---|---|---|
| Youth sports sponsorship | Season-long | 200-500 families |
| Chamber meetings | Weekly/Monthly | 20-50 business owners |
| Community workshops | Quarterly | 15-40 attendees |
| Local event volunteering | Monthly | 100-300 contacts |
Direct Mail That Still Works
Direct mail delivers. According to Postalytics, direct mail achieves 112% ROI, the highest across all marketing channels. LS Direct reports direct mail shows a 4.4% average response rate in 2024, compared to email’s 0.12%.
New homeowner lists from data providers hit people exactly when they need coverage. They just bought a house and must get insurance immediately.
Targeted neighborhood campaigns focus on specific areas where you want more clients. High-value homes or underserved communities both work.
Dimensional mail (anything bulkier than a letter) gets opened more often. Sending a small branded notepad with your contact info costs more but gets noticed.
According to the Association of National Advertisers, oversized envelopes have the highest response rates, followed by postcards (5.7%) and letter-sized envelopes (4.3%).
Postcards work for simple messages. “Average homeowners in [Neighborhood] saved $680 switching to us” with a clear call-to-action.
Personalization matters. UPrinting reports that personalizing with the recipient’s name increases response rates by 135%. SG360’s 2024 research found 97% of direct mail users see higher response rates with personalized mail.
Combine direct mail with digital follow-up. Mail arrives Tuesday, Facebook ads targeting that zip code start Wednesday.
REsimpli found campaigns combining direct mail with digital media see a 118% lift in response rate. A luxury e-commerce brand test showed customers receiving both catalogs and emails had 15% higher sales and 27% more inquiries than email-only recipients.
Track response rates religiously. Direct mail costs add up fast, and knowing your ROI prevents wasted spending.
| Format | Average Response Rate |
|---|---|
| Oversized envelope | Highest |
| Postcard | 5.7% |
| Letter-sized envelope | 4.3% |
| Personalized mail | 6.5% |
| Non-personalized | 2.0% |
CRM and Lead Management Systems
Choosing the Right CRM
Insurance-specific CRMs like AgencyBloc or Applied Epic understand policy management, renewal tracking, and commission structures.
General CRMs like HubSpot or Salesforce work fine but require customization. You’ll spend time building workflows that insurance CRMs have pre-built.
According to Nucleus Research, the average ROI from CRM implementation is $8.71 for every dollar spent. For insurance specifically, CRM systems can deliver returns as high as $5.60 per dollar invested according to Nucleus Research.
Email and calendar integration prevents duplicate data entry. Meeting scheduled in Google Calendar should automatically create a task in your CRM.
Mobile apps matter for agents who work outside the office. Updating lead notes from your phone after a coffee meeting keeps information current.
Nucleus Research found mobile CRM access boosts sales productivity by 14.6%. Freshworks reports that 65% of salespeople with mobile CRM access meet their sales quotas, compared to only 22% who don’t.
Automation capabilities separate basic CRMs from powerful ones. Can it send follow-up emails automatically? Create tasks based on lead behavior? Score leads by engagement?
Salesforce research shows CRM applications can increase sales by 29%, boost sales productivity by 34%, and improve sales forecast accuracy by 42%.
Price matters but shouldn’t be the only factor. A $50/month CRM that saves you 10 hours weekly beats a $20/month option that requires constant manual work.
CRM Selection Checklist:
| Feature | Why It Matters |
|---|---|
| Insurance-specific workflows | Pre-built policy and renewal tracking |
| Mobile app | 14.6% productivity boost (Nucleus Research) |
| Email/calendar integration | Eliminates duplicate data entry |
| Automation capabilities | 80% reduction in admin tasks (CRM.org) |
| Reporting dashboard | 42% better forecast accuracy |
Lead Scoring and Prioritization
Assign point values to different actions. Website visit = 5 points. Quote request = 25 points. Phone call = 50 points.
Hot leads need contact within an hour. Someone who just requested a quote is comparing agents right now.
The data is clear: Harvard Business Review research shows businesses that respond within one hour are 7x more likely to have meaningful conversations with decision-makers. Rep.ai reports that responding within one minute can boost conversions by 391%.
| Response Time | Conversion Impact |
|---|---|
| Within 1 minute | 391% more conversions |
| Within 5 minutes | 21x more likely to qualify lead |
| Within 1 hour | 7x more likely to reach decision-maker |
| After 30 minutes | 21x less effective than 5-minute response |
| After 5 minutes | Qualification odds drop 80% |
Warm leads get follow-up within 24 hours. They showed interest but aren’t urgently shopping.
Cold leads receive automated nurture sequences. Monthly emails keep you top-of-mind without requiring personal attention.
Stop pursuing leads after six touchpoints with no response. Some people will never convert, and chasing them wastes time.
According to Amplemarket research, 78% of B2B customers buy from the vendor who responds first. Yet the average B2B response time is 42 hours, and InsideSales found that 57.1% of first call attempts occur after more than a week.
Vertafore and similar platforms automate lead scoring based on behavior patterns. The system learns which actions predict conversions.
Lead Response Benchmarks:
- Average business response time: 47 hours (Rep.ai)
- Only 0.1% of inbound leads are engaged within 5 minutes (InsideSales)
- 30% of leads are never contacted at all (Forbes)
- First responders win 35-50% of sales (Vendasta)
Automation Without Losing the Human Touch
Automated follow-up sequences handle routine communications. Day 1: Thanks for requesting a quote. Day 3: Here’s what we need from you. Day 7: Still interested?
Freshworks research shows CRM automation reduces employee workload by 5-10 hours per week for 43% of businesses. Half of respondents say this time is saved by automating repetitive tasks.
Task creation based on lead behavior keeps nothing falling through cracks. Form submission automatically creates “call within 1 hour” task.
Appointment scheduling tools like Calendly eliminate phone tag. Leads book directly into your calendar at times you’ve marked available.
Manual intervention matters for high-value prospects. Automation handles the first three touches, you personally reach out on touch four.
HubSpot’s 2024 research found that 74% of sales professionals with AI-enhanced CRMs report being more productive since adding AI features. For automating manual processes like data entry, 43% of salespeople say it yields positive ROI.
Birthday reminders, policy renewal alerts, and coverage review prompts all automate easily while feeling personal when executed well.
Balance efficiency with authenticity. Templates are fine for initial outreach, but responses to questions should be personal and specific.
CRM Productivity Impact (Freshworks 2024 Survey):
| Metric | Result |
|---|---|
| Businesses seeing productivity increase | 94% |
| Productivity boost range | 10-29% (44% of businesses) |
| Sales cycle reduction | 8-14 days (34% of businesses) |
| Customer acquisition cost decrease | 11-20% (nearly half of businesses) |
Automation Priority Matrix:
- Automate fully: Follow-up email sequences, task creation, appointment reminders, birthday/renewal alerts
- Automate with review: Initial outreach templates, lead scoring updates, report generation
- Keep manual: High-value prospect outreach, complex questions, complaint resolution, relationship building
Key Implementation Stats:
- 91% of businesses with 10+ employees use CRM (DemandSage)
- 27% increase in customer retention after CRM implementation (LinkPoint360)
- 300% potential conversion rate increase with right CRM platform (LinkPoint360)
- 98% of buyers rate sales automation as most important CRM feature (Capterra)
- CRM adoption failure rate: 20-70% primarily due to poor user adoption (SLT Creative)
Measuring and Improving Performance
Metrics That Actually Matter
Cost per lead by source tells you where to spend more money. Facebook might deliver $25 leads while Google delivers $60 leads, but conversion rates flip that equation.
According to First Page Sage, the average cost per lead for insurance is $424 ($460 paid, $388 organic). However, costs vary dramatically by lead type:
| Lead Type | Average Cost |
|---|---|
| Auto insurance | $16.33 (survey average) |
| Life insurance | $25.44 (survey average) |
| Health insurance | $8-$18 |
| Exclusive real-time leads | $75-$200 |
| Aged leads (30-90 days) | $0.50-$3.00 |
Lead-to-quote conversion shows how well you’re qualifying prospects. Getting 100 leads monthly but only quoting 10 means your targeting is off.
The average website conversion rate for insurance is 9% according to industry research. This means roughly 9 of every 100 website visitors take a desired action like requesting a quote.
Quote-to-policy conversion reveals your closing ability. Industry average hovers around 20-25% for most insurance types.
Synthesized data analysis of 67,504 insurance quotes showed an 18% conversion rate from quote to policy. Best-in-class companies close 30% of sales qualified leads while average companies close 20%, according to TrueList.
Customer acquisition cost includes everything. Ad spend, your time, CRM costs, and any incentives paid divided by policies sold.
To acquire one new auto insurance client on the low end (8% close rate), expect to purchase 12 leads at approximately $195-$346 total in lead costs according to SEOWithDavid research.
Track lifetime value separately by coverage type. Life insurance clients stick around longer than auto insurance clients who shop annually.
The average auto insurance customer stays 5 years before switching. Life insurance policies generate recurring commissions for decades, making those leads worth significantly more despite higher upfront costs.
Don’t obsess over vanity metrics. Website traffic looks impressive but means nothing if visitors don’t convert.
Testing and Optimization
Change one variable at a time. New headline or new image, not both simultaneously.
Sample size requirements matter more than most agents realize. Twenty form submissions isn’t enough data to declare a winner.
Industry experts suggest a minimum of 100 conversions per variation to ensure statistical significance. For a 5% conversion rate page, that means approximately 2,000 visitors per variation before drawing conclusions.
| Baseline Conversion | Minimum Visitors Per Variation |
|---|---|
| 10% | ~1,000 |
| 5% | ~2,000 |
| 2% | ~5,000 |
| 1% | ~10,000+ |
Document test results in a spreadsheet. What you tested, dates, results, and whether you implemented changes.
Winners get implemented, but keep testing. What works today might stop working in six months as markets shift.
Form abandonment happens at specific fields. Analytics show exactly where people quit filling out your quote request.
A/B testing tools like Google Optimize or VWO make split testing easier. Half your traffic sees version A, half sees version B.
A/B Testing Best Practices:
- Run tests for 2-6 weeks minimum (results shorter than this may not hold over time)
- Use 95% confidence level as the industry standard
- Set 80% statistical power to detect real effects
- Test one element at a time for clear attribution
- Document baseline conversion rate before testing
Attribution and ROI Tracking
Multi-touch attribution reveals the real customer journey. Someone might see your Facebook ad, then Google your name, then call after receiving your postcard.
According to Forrester, 82% of customers view five or more content items from the winning vendor before making a purchase. EmailToolTester research shows the number of touchpoints before a sale varies from 1 to 50+ depending on buyer readiness.
First-click attribution credits the initial touchpoint. Last-click credits the final interaction before conversion.
Most insurance sales involve 5-8 touchpoints before purchase. Crediting just one touch misses the complete picture.
Research consistently shows it takes an average of 8 touchpoints to close a sale. TrueList reports 80% of sales are made on the fifth to twelfth contact. Dreamdata found B2B customers need 62.4 interactions across 3.5 different channels before closing.
| Touchpoint Stage | What Happens |
|---|---|
| 1-3 | Awareness building |
| 4-6 | Consideration and research |
| 7-8 | Decision and purchase |
| 9+ | Complex or high-value sales |
Offline conversions complicate tracking. Phone calls, office visits, and referrals don’t automatically feed into Google Analytics.
Call tracking numbers from providers like CallRail connect phone leads to specific campaigns. Different numbers for different ad sources reveal what drives calls.
Long-term value calculations require patience. A client who buys one auto policy today might add home, life, and umbrella policies over five years.
Attribution Tracking Checklist:
- Set up unique phone numbers per channel
- Create campaign-specific landing pages with UTM parameters
- Track form submissions by source in CRM
- Document offline conversions manually (referrals, walk-ins)
- Calculate customer lifetime value by initial lead source
- Review attribution monthly and reallocate budget quarterly
Key Performance Benchmarks:
| Metric | Average | Top Performers |
|---|---|---|
| Website conversion rate | 9% | 15%+ |
| Quote-to-policy conversion | 18-20% | 30%+ |
| Cost per lead (insurance) | $424 | Under $100 (organic) |
| Touchpoints to close | 8 | 5-6 |
| Lead response time | 47 hours | Under 5 minutes |
Compliance and Ethical Considerations
Regulatory Requirements
State-specific advertising rules vary wildly. What’s legal in Texas might violate Florida regulations.
Your license number belongs on all marketing materials in most states. Websites, business cards, brochures, and ads all require it.
Disclosure requirements for certain coverage claims need clear language. “Guaranteed acceptance” life insurance must explain limitations prominently.
Do Not Call list compliance isn’t optional. Scrub your calling lists against the federal registry quarterly.
TCPA violations are exploding. WebRecon data shows TCPA case filings jumped 67% in 2024 compared to 2023. A staggering 85.3% of December 2024 filings were class actions.
| TCPA Penalty Type | Amount |
|---|---|
| Standard fine (per violation) | $500 |
| Willful violation (per call/text) | $1,500 |
| FCC fine (per unauthorized instance) | Up to $10,000 |
One lawsuit wipes out months of commission income. The National Law Review reports TCPA class action filings were up over 250% in January 2025 year-over-year.
Data breach costs hit record highs. IBM’s 2024 Cost of a Data Breach Report shows the global average reached $4.88 million per breach. Small businesses with fewer than 500 employees face average costs of $3.31 million. According to Verizon, around 60% of small businesses close within six months of a cyberattack.
Data privacy regulations like CCPA (California) or state insurance laws dictate how you store and use client information.
Ethical Lead Generation Practices
Transparent pricing and coverage information builds trust faster than vague promises. Don’t hide exclusions or limitations in fine print.
Trust drives purchases. BrightLocal research shows 85% of consumers trust local business reviews, and over 99% consult them before choosing a business.
Fear-based marketing works but damages your reputation. “You’ll lose everything without this coverage” pushes people away long-term.
Fake reviews carry real penalties. The FTC’s final rule banning fake reviews went into effect October 21, 2024. Penalties reach up to $51,744 per violation. The FTC Chair called this “strengthening the FTC’s toolkit to fight deceptive advertising.”
Honest testimonials mean actual clients, not made-up reviews. Google and most states require genuine feedback only.
| Consumer Review Behavior | Percentage |
|---|---|
| Read reviews before purchase | 93% |
| Trust reviews as much as personal recommendations | 49% |
| Won’t buy if they suspect fake reviews | 54% |
| Believe they’ve read a fake review in past year | 82% |
*Data from Business Dasher and BrightLocal 2024 surveys
Protecting client data goes beyond legal requirements. Encrypt forms, use secure storage, and limit access to sensitive information.
Following proper form security practices protects both you and your clients from data breaches.
Overselling coverage people don’t need creates short-term commissions but destroys long-term relationships.
Avoiding Common Legal Pitfalls
Misleading advertising triggers serious penalties. A 2024 Massachusetts judgment assessed $115 million in civil penalties plus $50 million in compensatory damages against an insurer for advertising violations. In California, agents face fines up to $25,000 per violation under state insurance law.
Spam email violations under CAN-SPAM require unsubscribe options, physical addresses, and accurate sender information.
| CAN-SPAM Violations | Penalty |
|---|---|
| Per email violation | Up to $53,088 |
| Largest FTC penalty to date | $2.95 million (Verkada, 2024) |
The FTC notes this Verkada penalty is the largest ever obtained for CAN-SPAM violations. The company sent over 30 million commercial emails over three years without proper unsubscribe options.
Social media disclosure requirements from the FTC mandate clear identification of sponsored content or partnerships.
Competitor name usage in ads walks a legal tightrope. “Better than State Farm” invites trademark complaints.
Recording calls requires consent in two-party consent states. California, Florida, and several others mandate disclosure before recording.
E&O insurance protects when mistakes happen. Research from the Independent Insurance Agents & Brokers of America shows failure to procure coverage accounts for 24% of E&O claims against P&C agents. For life/health agents, misrepresentation causes 25% of claims.
| E&O Claim Triggers (P&C Agents) | Percentage |
|---|---|
| Failure to procure coverage | 24% |
| Failure to explain policy provisions | 7% |
| Failure to identify exposures | 6% |
| Failure to recommend coverage | 5% |
Every independent agent needs E&O coverage. Insurance agencies pay an average of $65 per month for E&O insurance according to Insureon.
Keep detailed records of all client communications. When disputes arise, documentation determines outcomes.
FAQ on Lead Generation For Insurance Agents
What’s the cheapest way to generate insurance leads?
Referrals from current clients cost the least and convert best. Ask satisfied policyholders for introductions immediately after delivering value. Social media content and local networking through chambers of commerce also generate qualified leads without significant ad spend.
How many leads do insurance agents need monthly?
Quality matters more than quantity. Ten well-qualified prospects beat 100 cold contacts. Independent agents typically need 20-30 qualified leads monthly to hit income goals, assuming 20-25% conversion rates from quote to policy sale across all coverage types.
Should I buy insurance leads or generate my own?
Generate your own for better ROI long-term. Buying exclusive leads from SmartFinancial or EverQuote works short-term but costs $50-150 per lead. Owned lead generation through content marketing and referrals builds sustainable pipelines without ongoing vendor dependence.
What’s the best social media platform for insurance agents?
Facebook for personal lines, LinkedIn for commercial insurance. Facebook’s life event targeting captures people buying homes, getting married, or having babies. LinkedIn reaches business owners who need commercial policies and workers’ comp coverage.
How quickly should I follow up on insurance leads?
Within one hour for hot leads requesting quotes. They’re comparing multiple agents right now. Warm leads get 24-hour follow-up. Automated email sequences handle cold leads, with personal outreach after they show engagement through opens or clicks.
Do insurance landing pages really improve conversions?
Yes, dramatically. Dedicated landing pages convert 20-40% better than sending traffic to homepages. Remove navigation, match ad copy to page headlines, and focus on one coverage type per page. Multi-step forms reduce abandonment.
What CRM works best for insurance agents?
AgencyBloc and Applied Epic are insurance-specific with built-in policy management. Salesforce and HubSpot work but require customization. Choose based on your book size. Smaller agencies under 500 clients often prefer simpler, affordable options with strong automation.
How do I track which lead sources convert best?
Tag every lead by source in your CRM. Track cost per lead, lead-to-quote conversion, and quote-to-policy conversion separately by channel. Calculate full customer acquisition cost including time spent. Lifetime value matters more than initial policy premium.
Are paid leads worth the cost for new agents?
Sometimes. New agents without networks need immediate pipeline flow. Buy small batches of exclusive leads to test vendors. Track conversion rates religiously. Transition to organic methods as you build referral networks and content marketing systems.
What’s the average conversion rate for insurance leads?
Industry averages: 20-25% quote-to-policy conversion for qualified leads. Referrals convert at 30-40%. Cold leads from most vendors convert at 5-10%. Your numbers depend on lead quality, follow-up speed, and how well you match products to needs.
Conclusion
Effective lead generation for insurance agents requires consistent systems, not random tactics. Your sales pipeline depends on multiple channels working together.
Start with one or two methods that match your strengths. Local networking and referrals work great for relationship-focused agents. Digital marketing suits those comfortable with technology and content creation.
Track your numbers religiously. Cost per acquisition, conversion rates by source, and lifetime policy value reveal what’s actually working versus what feels busy.
Investment in proper CRM systems and automated follow-up sequences pays off quickly. AgencyBloc or Salesforce keep prospects from falling through cracks while you focus on high-value activities.
Remember that buying shared leads from InsuranceLeads.com keeps you dependent on vendors. Building organic lead flow through content marketing, social media presence, and strategic partnerships creates long-term business stability.
Stop chasing every prospect. Focus on qualified leads who match your ideal client profile, follow up fast, and let your systems handle the rest.