
Gallup’s 2024 data shows only 31% of U.S. employees feel engaged at work. Annual surveys can’t catch that kind of decline fast enough. Pulse surveys can. These short, frequent questionnaires…
Table of Contents
Most agencies struggle with feast-or-famine cycles because they treat lead generation for agencies like an afterthought. While you’re busy delivering excellent work for current clients, your pipeline quietly empties.
Service-based businesses face unique challenges that product companies don’t encounter. Longer sales cycles, relationship-dependent deals, and the need to demonstrate expertise before prospects even consider hiring you.
This guide reveals proven client acquisition strategies that transform inconsistent inquiries into predictable revenue streams. You’ll discover how to build systematic processes that generate qualified prospects while you focus on client work.
We’ll cover everything from building your foundation and content marketing to advanced tactics like marketing automation and performance optimization. By the end, you’ll have a complete blueprint for sustainable agency growth.
Building Your Agency’s Lead Generation Foundation
Getting the fundamentals right makes everything else easier. Most agencies jump straight into tactics without laying proper groundwork. 61% of marketers believe that quality lead generation is the number one challenge that they face.
Creating Your Ideal Client Profile
You can’t hit a target you haven’t defined. Organizations generate 1,877 leads per month on average, but most waste resources on unqualified prospects.
Company characteristics matter more than you think. B2B conversion rates vary significantly by company size, with companies over 1,000 employees paying $349 per lead, while those with up to 50 employees pay $47 per lead.
Geographic considerations play a huge role in service delivery. Local clients often prefer face-to-face meetings. Remote relationships require different trust-building approaches.
Pain Point Mapping
Every potential client struggles with specific challenges. 91% of surveyed marketing leaders believe generative AI will substantially transform their content creation within 2024. Digital marketing agencies often see prospects frustrated with poor conversion rates.
Document these pain points systematically. Create detailed buyer personas that go beyond demographics. What keeps your ideal client awake at night?
Ideal Client Profile Template
| Criteria | Primary Target | Secondary Target |
|---|---|---|
| Company Size | 50-500 employees | 20-50 employees |
| Annual Revenue | $5M-$50M | $1M-$5M |
| Industry | SaaS/Tech | Professional Services |
| Pain Points | Low conversion rates | Inconsistent leads |
| Budget Range | $5K-$15K/month | $2K-$5K/month |
| Decision Timeline | 3-6 months | 1-3 months |
Developing Your Value Proposition
Generic positioning kills deals before they start. “We help businesses grow” means absolutely nothing. 75% of decision-makers say a single piece of compelling thought leadership prompted them to research a service they weren’t considering before.
Service differentiation starts with understanding what you do differently. Lead conversion rates for agencies average 3.3%. Most agencies struggle to stand out because they use generic messaging.
Industry expertise positioning creates immediate credibility. 60% of B2B buyers say good thought leadership makes them willing to pay a premium to work with that firm. A marketing consultancy that only works with law firms commands higher fees than generalists.
Results-Focused Messaging
Numbers speak louder than promises. Nurtured B2B leads generate 47% larger purchases than non-nurtured leads at a 33% lower cost. Instead of claiming you “increase sales,” specify that you “generate 40% more qualified leads within 90 days.”
Value Proposition Framework
[Industry] companies struggling with [specific problem] can [achieve specific outcome] in [timeframe] through our [unique method].
Example: SaaS companies struggling with low trial-to-paid conversion rates can increase conversions by 35% within 90 days through our behavioral trigger optimization system.
Building Conversion-Ready Assets
Your website forms capture visitors or lose them forever. A study by Ruler Analytics shows the average form conversion rate across all industries is 1.7%. Every form field creates friction.
Landing page optimization directly impacts your customer acquisition cost. If your site loads in a brisk one second, your conversion rates could triple compared to a five-second load time. Test headlines, images, and calls-to-action systematically.
Essential Lead Magnets
Free resources attract prospects while demonstrating expertise. 87% of marketers report that content marketing generates demand and leads, indicating an 11-percentage point increase since 2023. Create guides that solve real problems your ideal clients face.
High-Converting Lead Magnet Ideas:
- Industry benchmarking reports (conversion rates, costs, performance metrics)
- Strategy templates and checklists with fill-in-the-blank sections
- Exclusive webinar access with Q&A sessions
- Free consultation offers with specific deliverables
Multi-step forms also bring higher conversion rates to the table, thanks to their friendlier, more laid-back vibe. Lead generation forms should request minimal information initially.
Lead Magnet Performance Tracker
| Lead Magnet | Views | Downloads | Conversion Rate | MQL Rate | Notes |
|---|---|---|---|---|---|
| Industry Report | 1,250 | 89 | 7.1% | 12% | High-quality leads |
| Template Pack | 890 | 156 | 17.5% | 8% | Volume play |
| Webinar Series | 650 | 98 | 15.1% | 22% | Best MQL source |
Form Optimization Checklist
Pre-Launch:
- [ ] Maximum 3 fields for initial capture
- [ ] Clear value proposition above form
- [ ] Mobile-responsive design tested
- [ ] Thank you page with next steps
- [ ] Email automation sequence ready
Post-Launch Testing:
- [ ] A/B test headlines weekly
- [ ] Monitor form abandonment rates
- [ ] Test single vs multi-step formats
- [ ] Track source-specific conversion rates
Service-Specific Assets
Different services require different proof points. Leads from organic search conversions result in 14.6% close rates, demonstrating high-value creation versus other channels. SEO agencies need keyword ranking improvements. Social media consultants showcase engagement metrics.
Asset Requirements by Service:
SEO Services:
- Ranking improvement case studies with specific keywords
- Traffic growth charts with revenue attribution
- Technical audit samples showing issues found
PPC Management:
- Before/after ROAS comparisons
- Cost reduction case studies
- Quality Score improvement examples
Content Marketing:
- Engagement rate improvements
- Lead generation attribution reports
- Brand awareness measurement results
Monthly Lead Generation Goals
Companies that tend to post more than 15 blogs per month generate around 1200 new leads each month on average.
| Month | Target Leads | MQLs | SQLs | New Clients | Revenue Goal |
|---|---|---|---|---|---|
| Month 1 | 150 | 30 | 8 | 2 | $15,000 |
| Month 2 | 175 | 35 | 10 | 2 | $18,000 |
| Month 3 | 200 | 45 | 12 | 3 | $25,000 |
| Q1 Total | 525 | 110 | 30 | 7 | $58,000 |
Implementation Timeline
Week 1-2: Foundation Setup
- Complete ideal client profile template
- Audit current website conversion points
- Install conversion tracking and analytics
Week 3-4: Asset Creation
- Design primary lead magnet
- Create landing page templates
- Set up email automation sequences
Week 5-6: Optimization
- Launch A/B tests on key pages
- Implement form optimization checklist
- Begin content creation schedule
Week 7-8: Scale & Measure
- Analyze initial performance data
- Refine targeting and messaging
- Scale successful campaigns
Success Metrics Dashboard
Track these weekly to ensure consistent improvement:
| Metric | Current | Target | Industry Avg | Status |
|---|---|---|---|---|
| Website Conversion Rate | 2.1% | 3.5% | 2.35% | ⬆️ |
| Form Completion Rate | 1.4% | 2.5% | 1.7% | ⬆️ |
| MQL to SQL Rate | 15% | 25% | 20% | ⬆️ |
| Cost Per Lead | $180 | $120 | $200 | ⬇️ |
| Lead Response Time | 4 hours | 1 hour | 2 hours | ⬇️ |
25% of leads come from the initial email, while the first and second follow-ups generate 28% and 27%, respectively. Most agencies lose 75% of potential revenue by not following up properly.
Build your foundation systematically. 53% of marketers spend more than 50% of their budget on lead generation for their business. Get the basics right before scaling, and every dollar invested will return more qualified prospects ready to buy your services.
Content Marketing for Agency Lead Generation
91% of B2B marketers say content marketing generates more leads than traditional marketing channels, making it essential for agency growth. Content marketing generates 3x more leads than outbound marketing while costing 62% less.
Strategic Content Planning
Random content creation wastes resources. Only 40% of B2B marketers have documented their content strategy, missing crucial opportunities for systematic growth.
Client Journey Content Framework
Map content to buying stages with specific objectives:
- Awareness stage: Industry challenges, trends, educational guides
- Consideration stage: Solution comparisons, case studies, ROI calculators
- Decision stage: Free consultations, detailed proposals, testimonials
Implementation Schedule:
- Week 1-2: Audit existing content by funnel stage
- Week 3-4: Identify content gaps for each stage
- Month 2: Create 3 pieces per funnel stage
- Ongoing: Track performance and adjust monthly
Industry-Specific Content Themes
Generic business advice gets ignored. 73% of B2B marketers say content marketing is the most effective strategy for boosting leads and sales when focused on industry needs.
Content Theme Templates by Industry:
| Industry | Top-Performing Topics | Monthly Target |
|---|---|---|
| Healthcare | HIPAA compliance, patient engagement | 8 pieces |
| Real Estate | Lead nurturing, market analysis | 6 pieces |
| Financial Services | Regulatory changes, compliance | 10 pieces |
Authority Building Content Types
85% of marketers want to focus on generating more leads in 2024. Position yourself as the strategic partner, not just another vendor.
High-Impact Content Formats
Performance by Content Type (Based on lead generation effectiveness):
- Case Studies: Nearly 90% of marketers say case studies are the most effective for influencing sales
- Industry Analysis: Predict trends affecting target market
- Behind-the-scenes processes: Show actual problem-solving methods
- Video Content: 87% of marketers report video campaigns help generate leads
Case Study Production System
Monthly Case Study Targets:
- Small agencies (under 10 employees): 2 case studies
- Medium agencies (10-50 employees): 4 case studies
- Large agencies (50+ employees): 6+ case studies
Template Structure:
- Challenge quantification (specific metrics)
- Strategic approach (methodology details)
- Implementation timeline (week-by-week breakdown)
- Measurable results (percentage improvements)
- Lessons learned (actionable insights)
Content Distribution Strategy
Content marketing generates 3 times more leads than outbound marketing, but only with proper distribution. Most marketers use an average of 18 different data sources for reporting.
Multi-Channel Distribution Framework
Channel Performance Benchmarks:
| Channel | Lead Conversion Rate | Cost Per Lead | Time Investment |
|---|---|---|---|
| 2.4% | $45 | 2 hours/week | |
| Email Newsletter | 2.8% | $31 | 3 hours/week |
| Industry Publications | 4.1% | $95 | 5 hours/week |
| Webinars | 8.2% | $125 | 8 hours/event |
Guest Posting ROI Calculator
Target Publications by Audience Size:
- Tier 1 (50k+ readers): 1 post/month, expect 15-25 qualified leads
- Tier 2 (10-50k readers): 2 posts/month, expect 8-15 qualified leads
- Tier 3 (under 10k readers): 3+ posts/month, expect 3-8 qualified leads
Guest Post Performance Tracking:
Lead Attribution Formula:
(Total leads from guest post / Cost of content creation) × Average client value = ROI
Content Amplification System
Social Media Lead Generation Rates:
- LinkedIn: 80% of B2B leads come through LinkedIn
- 68% of marketers say social media marketing helps generate leads
Weekly Amplification Schedule:
- Monday: LinkedIn article sharing
- Tuesday: Twitter thread with key insights
- Wednesday: Facebook group participation
- Thursday: Industry forum contributions
- Friday: Email newsletter distribution
Email Marketing Performance Metrics
Email is considered one of the most important lead generation factors by 42% of companies. Businesses get $36 in return for every $1 spent on email marketing.
Email Optimization Benchmarks:
- Best send times: 1 p.m. gets best results, followed by 8 a.m., 4 p.m., and 6 p.m.
- Target open rate: 25-30% for B2B agencies
- Click-through rate: 3-5% industry average
- Conversion rate: 2.8% for B2C, 2.4% for B2B
Content Performance Tracking
Only 65% of marketers have identified their KPIs for content marketing success. 72% of successful companies measure their content marketing ROI.
Monthly Performance Dashboard
Essential Metrics to Track:
| Metric | Industry Benchmark | Your Target | Actual |
|---|---|---|---|
| Blog traffic growth | 55% increase | __% | __% |
| Lead generation rate | 3x traditional marketing | __x | __x |
| Content-to-lead ratio | 13:1 (13 pieces consumed before purchase) | __:1 | __:1 |
| Email conversion rate | 2.4-2.8% | __% | __% |
| Case study completion rate | 89% effectiveness for sales | __% | __% |
ROI Calculation Template
Content Marketing ROI Formula:
ROI = (Revenue Generated - Content Costs) / Content Costs × 100

Example:
- Content costs: $5,000/month
- New client revenue: $25,000/month
- ROI: ($25,000 - $5,000) / $5,000 × 100 = 400%
Break down by content type:
- Blog posts: Average return $2.77 for every dollar invested
- Video content: 93% of video marketers report positive ROI
- Case studies: 6x higher conversion rates than other methods
Weekly Action Plan Template
Monday – Content Planning:
- Review last week’s performance metrics
- Identify top-performing content themes
- Plan upcoming week’s content calendar
Wednesday – Mid-Week Check:
- Monitor social media engagement
- Respond to comments and questions
- Share user-generated content
Friday – Performance Review:
- Analyze weekly traffic and leads
- Update content performance dashboard
- Plan next week’s improvements
Track these metrics using Email marketing campaigns and analytics tools to measure true ROI impact on agency growth.
Search Engine Optimization for Agencies
SEO drives qualified prospects to your agency naturally. But service-based businesses need different approaches than product companies.
46% of all Google searches have local intent, making local SEO critical for agencies. 80% of US consumers search online for local businesses on a weekly basis, and 32% search for them daily.
Local and Service-Based SEO
Geographic targeting connects you with nearby clients. Customers are 2.7 times more likely to trust a business if they come across a complete Business Profile on search and Google Maps.
Google My Business optimization ranks you for location-based searches. Verified businesses receive over 21,643 views each year in Google searches. Complete your profile with accurate business information, photos, and regular updates. 88% of consumers who conduct a local search on their smartphone visit or call a store within a day.
Service page optimization targets specific offerings. Create dedicated pages for each service you provide. A digital marketing agency needs separate pages for SEO, PPC, and social media management.
Local Business Listing Management
Consistent NAP (Name, Address, Phone) information across directories improves rankings. Submit your agency to industry-specific directories and local business listings.
Key directories include:
- Google My Business
- Bing Places
- Yelp for Business
- Better Business Bureau
- Industry associations
Monitor these listings regularly. Incorrect information confuses search engines and potential clients.
Local SEO Performance Benchmarks:
- 42% of local searches involve clicks on the Google Map Pack
- 83% of consumers use Google to find local business reviews
- Only 48% of consumers would consider using a business with fewer than 4 stars
Content SEO for Lead Generation
Keyword research reveals what prospects actually search for. Use tools like SEMrush or Ahrefs to identify opportunity gaps. Target keywords your competitors miss.
Long-tail keywords often convert better than broad terms. “Marketing agency for SaaS startups” attracts more qualified leads than “marketing agency.”
92.3% of users access the internet using a mobile phone, making mobile optimization essential for content success.
Featured Snippet Optimization
Featured snippets capture prominent search real estate. Featured snippets have the highest clickthrough rate (CTR) at 42.9%. Structure content to answer common questions directly.
99.58% of featured snippets already rank in positions 1 through 10 on Google. Use numbered lists, bullet points, and clear headings.
Target question-based keywords:
- “How to choose a marketing agency”
- “What does a creative agency do”
- “Marketing agency pricing models”
Answer these questions comprehensively within the first 100 words. 30% of people click on featured snippets because they find the displayed text helpful.
Implementation Template:
| Question Type | Content Format | Word Count |
|---|---|---|
| How-to queries | Numbered lists | 50-75 words |
| Definition queries | Paragraph format | 40-60 words |
| Comparison queries | Table format | 100-150 words |
Technical SEO Considerations
| ✓ | Technical SEO Item | Benchmark/Target | Notes/Status |
|---|---|---|---|
| SITE SPEED OPTIMIZATION | |||
| Page load speed under 3 seconds | Target: < 2 seconds (53% abandon after 3s) | Test with GTmetrix, PageSpeed Insights | |
| Mobile page speed optimized | Mobile load time < 3 seconds | 72.6% users mobile-only by 2025 | |
| Core Web Vitals passing | LCP < 2.5s, FID < 100ms, CLS < 0.1 | Direct ranking factor | |
| Images optimized (WebP format) | Compressed, properly sized, lazy loading | Can reduce load time by 30-50% | |
| CSS and JavaScript minified | Remove whitespace, combine files | Use tools like UglifyJS, CSSNano | |
| CDN implemented | Global content delivery network | Cloudflare, AWS CloudFront | |
| MOBILE OPTIMIZATION | |||
| Mobile-friendly test passes | Google Mobile-Friendly Test | Test at search.google.com/test/mobile-friendly | |
| Responsive design implemented | Works on all screen sizes | Test: 320px, 768px, 1024px, 1200px+ | |
| Touch targets properly sized | Minimum 44px tap targets | Buttons, links, form fields | |
| Viewport meta tag configured | <meta name=”viewport” content=”width=device-width, initial-scale=1″> | Essential for mobile rendering | |
| SCHEMA MARKUP IMPLEMENTATION | |||
| LocalBusiness schema added | Complete NAP + business hours | Critical for local search | |
| Service schema on all service pages | Each service marked up individually | SEO, PPC, Social Media pages | |
| FAQ schema implemented | FAQ pages with proper markup | Eligible for featured snippets | |
| Review schema on testimonials | Client testimonials marked up | May show star ratings in SERPs | |
| Organization schema added | Company info, logo, social profiles | Helps with knowledge panel | |
| TECHNICAL FOUNDATION | |||
| SSL certificate installed | HTTPS enabled site-wide | Ranking factor + trust signal | |
| XML sitemap submitted | Google Search Console + Bing | Include all important pages | |
| Robots.txt configured | Proper crawl directives | Block admin, thank you pages | |
| 404 errors fixed | No broken internal links | Check Search Console regularly | |
| Canonical tags implemented | Prevent duplicate content issues | Especially important for CMS sites | |
📋 Audit Instructions:
- Check each item systematically using the testing tools mentioned
- Mark items complete only when they meet the benchmark targets
- Prioritize items that are direct ranking factors (Core Web Vitals, Mobile-friendly, HTTPS)
- Re-audit monthly to catch any regressions or new issues
Site speed affects both rankings and conversions. 53% of users abandon a website if it takes more than 3 seconds to load. The average page speed of a first-page Google result is 1.65 seconds.
Mobile optimization isn’t optional anymore. By 2025, 72.66% of internet users will exclusively use a mobile device to access the web. Most prospects research agencies on their phones.
Site Speed Performance Benchmarks:
- 9.1% more shoppers added items to their basket when mobile site speed increased by just 0.1 seconds
- Sites that load in 1 second have a 7% bounce rate
- A one-second delay in mobile load time can result in a 20% drop in conversion rates
Schema Markup Implementation
Schema markup helps search engines understand your content. Implement LocalBusiness schema for location information. Use Service schema to mark up your offerings.
Websites with structured data markup are featured in over 34% of voice search results. This becomes critical as 71% of internet users prefer to conduct voice searches instead of typing a query.
Schema Implementation Checklist:
- [ ] LocalBusiness schema with NAP data
- [ ] Service schema for each offering
- [ ] Review schema for testimonials
- [ ] FAQ schema for common questions
- [ ] Organization schema for company info
Conversion tracking setup measures SEO success properly. Install Google Analytics and Google Tag Manager. Track form submissions, phone calls, and email clicks as conversions.
SEO Investment Guidelines
Understanding SEO costs helps agencies budget effectively. 53% of agencies prefer monthly retainers over other pricing models. The most popular pricing ranges are $500-$1000 per month, $50-$100 per hour, and $500-$2000 per project.
Average SEO Investment Benchmarks:
- Small agencies: $500-$2,500/month
- Medium agencies: $2,500-$7,500/month
- Enterprise agencies: $7,500+/month
70% of agencies either increased their SEO pricing in 2024 or plan to in 2025. Factor this into long-term planning.
ROI Expectations:
- The typical return on investment (ROI) for SEO is 748% ($7.48 for every $1 spent)
- Results typically appear within 4-6 months of consistent effort
- Local SEO campaigns take 4.76 months before becoming ROI positive
Implementation Action Plan
Week 1-2: Foundation
- [ ] Claim and optimize Google My Business profile
- [ ] Audit current NAP consistency across directories
- [ ] Install Google Analytics and Search Console
- [ ] Conduct technical SEO audit
Week 3-4: Content Strategy
- [ ] Complete keyword research for target services
- [ ] Create FAQ content targeting featured snippets
- [ ] Optimize existing service pages for local keywords
- [ ] Implement schema markup
Month 2-3: Content Creation
- [ ] Publish 2-3 service-specific landing pages weekly
- [ ] Create location-specific content for target markets
- [ ] Build citation profile across relevant directories
- [ ] Start monthly reporting and tracking
Ongoing Monthly Tasks:
- [ ] Monitor rankings and traffic growth
- [ ] Update Google My Business posts weekly
- [ ] Create FAQ content based on client questions
- [ ] Track conversion metrics and ROI
Success Metrics to Track:
| Metric | Benchmark | Frequency |
|---|---|---|
| Local pack rankings | Top 3 positions | Weekly |
| Organic traffic growth | 20-30% quarterly | Monthly |
| Lead form submissions | Track baseline +15% | Weekly |
| Page load speed | Under 2 seconds | Monthly |
| GMB views | 21,000+ annually | Monthly |
This data-driven approach ensures your agency SEO delivers measurable results while establishing authority in your target market.
Social Media Lead Generation Strategies
68% of marketers say social media marketing has helped them generate leads, making it one of the most effective channels for business growth. Different platforms serve unique purposes in your lead generation funnel.
Platform-Specific Lead Generation Performance
LinkedIn Dominates B2B Lead Generation
LinkedIn is 277% more effective for lead generation than Facebook and X, with 80% of all B2B leads from social media coming from LinkedIn. 53% of B2B marketers use LinkedIn to identify prospects and source contact details.
Implementation Schedule:
- Week 1: Optimize your LinkedIn profile and company page
- Week 2: Begin connecting with 10-15 prospects daily
- Week 3: Start sharing industry insights 3x per week
- Week 4: Launch LinkedIn Lead Gen Forms campaigns
Performance Benchmarks:
- Average engagement rate: 2.8%
- Average visit duration: 10 minutes 48 seconds
- Lead Gen Forms generate up to 4x more leads
Instagram Visual Storytelling for Lead Capture
79% of marketers use Instagram for marketing their products and services. Creative agencies benefit most from Instagram’s visual nature with conversion rates of 1.1% for brands with up to 100k followers.
Content Performance Tracking:
- Stories CTR: 0.33-0.54%
- Feed ads CTR: 0.22-0.88%
- Reels reach rate: 30.81%
Weekly Action Plan:
- Monday: Share behind-the-scenes content
- Wednesday: Post client work samples
- Friday: Team personality content
- Daily: Engage with prospect Stories
Social Selling Performance Metrics
66% of marketers generate high-quality leads by spending only 6 hours per week on social media marketing. 21% of businesses generate most leads through organic social media searches.
Lead Generation ROI by Platform:
| Platform | Lead Generation Effectiveness | Best Use Case |
|---|---|---|
| 80% of B2B social leads | B2B networking | |
| 67% prefer for lead gen | Local businesses | |
| 1% average conversion rate | Visual brands | |
| 90%+ leads convert to sales | Real-time engagement |
Social Proof Development
Client testimonials on social media carry more weight than website testimonials. Social media has generated almost double the leads compared to telemarketing, PPC, or direct mail.
Engagement Optimization:
- Marketers get better at generating leads the longer they use social platforms
- Only 40% of marketers using a platform for less than a year find it effective, compared to 73% for those using it 4+ years
Social Media Advertising Performance
Social media advertising spend is projected to reach $276.7 billion in 2025. Platform selection depends on your target audience.
Ad Performance Benchmarks:
- LinkedIn ads: 2-5x higher ROAS in Tech than other platforms
- Instagram: CPC rates: $0.00-$0.25
- Facebook: 9.21% conversion rate benchmark
Creative Testing Implementation
Test multiple ad variations systematically. Vertical ads on LinkedIn have 11% higher CTR than horizontal ads.
A/B Testing Schedule:
- Week 1: Test headlines (3 variations)
- Week 2: Test images (3 variations)
- Week 3: Test CTA buttons (3 variations)
- Week 4: Test audience segments
Landing page forms connected to social ads should match messaging. Landing page conversion rates average 9.7% across sectors.
Budget allocation requires ongoing optimization. For B2B brands, paid social media content is the 2nd highest ROI channel.
Video Content Lead Generation
74% of marketers said video content outperformed other content types in driving conversions. 70% of B2B marketers say marketing video content helps convert leads.
Video Performance Stats:
- 84% say watching a video convinced them to purchase
- Videos on landing pages boost conversion rates by up to 80%
- 95% of video marketers say video helps increase product understanding
Content Creation Budget:
- 42% of video marketers spend $0-$500 per video
- 88% of video marketers report positive ROI
Advanced Social Strategies
Retargeting Campaign Setup:
- Install tracking pixels on website
- Create custom audiences (30-day website visitors)
- Develop ad sequences for different funnel stages
- Set 90-day view-through conversion windows
Using quizzes and interactive content generates higher engagement. Multi-step forms can increase conversions by up to 300%.
Lead Nurturing Performance:
- Companies that nurture leads generate 50% more sales with 33% lower costs
- 20% more sales generated through nurtured leads
- Answering leads within 5 minutes increases conversion rates 9x
Implementation Tracking Template
Weekly Performance Metrics:
| Metric | Target | |||
|---|---|---|---|---|
| New Connections | ___ | ___ | ___ | 50 |
| Engagement Rate | ___ | ___ | ___ | 2.5% |
| Leads Generated | ___ | ___ | ___ | 20 |
| Cost Per Lead | ___ | ___ | ___ | <$50 |
Monthly Action Items:
- Review and optimize top-performing content
- Analyze competitor social media strategies
- Update buyer personas based on engagement data
- Test new content formats and posting times
Success Benchmarks:
- Average lead conversion rate across industries: 2.9%
- Professional services achieve highest conversion rate: 9.3%
- Target: Generate 1,200+ leads monthly with 15+ blog posts
Email Marketing and Nurturing Campaigns
Email remains the highest ROI channel for most agencies. For every $1 spent on email marketing, agencies can expect an average return of $42. 75% of agency respondents rated email marketing as an excellent digital marketing channel for ROI.
Email builds relationships systematically while maintaining consistent touchpoints with prospects. 59% of B2B marketers rate email as their most effective channel for prospecting, making it essential for agency lead nurturing.
List Building Strategies
Opt-in incentives attract subscribers willingly. 86% of consumers claim they are willing to share their email address for personalized experiences and special incentives. Offer valuable resources that solve real problems.
Website capture optimization places forms strategically throughout your site. Email collection forms convert relatively highly, with an average conversion rate of 15%. Contact forms in your footer capture casual browsers. Pop-up forms target visitors showing exit intent.
High-Converting Lead Magnets
Industry reports and benchmarking data (download rates: 12-18%)
- Agency-specific performance benchmarks
- Industry trend analyses with actionable insights
- ROI calculators with customizable inputs
Strategy templates and checklists (download rates: 15-22%)
- Fill-in-the-blank campaign planning worksheets
- Client onboarding process templates
- Budget allocation frameworks
Event and Webinar Registrations
Webinar registration forms build targeted lists quickly. Educational webinars attract qualified prospects naturally. They’re already interested in learning from you.
Welcome emails achieve an impressive average open rate of 83.63%, making post-registration follow-up critical for conversion.
Effective registration incentives include:
- Exclusive industry insights with data others don’t share
- Free strategy sessions with specific deliverables
- Downloadable resources available only to attendees
- Early access to premium content
Post-event conversion tactics:
- Send presentation slides within 2 hours (optimal window)
- Include exclusive bonus materials not shared during webinar
- Offer limited-time consultation discount (24-48 hour window)
- Create urgency with limited availability messaging
Lead Magnet Performance Tracker
| Lead Magnet Type | Download Rate | Email-to-MQL Rate | MQL-to-Client Rate | Revenue Per Download |
|---|---|---|---|---|
| Industry Report | 14.2% | 18% | 8% | $45 |
| Strategy Template | 19.1% | 12% | 12% | $38 |
| Webinar Access | 11.8% | 25% | 15% | $67 |
| ROI Calculator | 16.7% | 22% | 10% | $52 |
Segmentation and Personalization
Behavioral segmentation improves relevance dramatically. Segmented email campaigns achieve a 14.31% higher open rate and a 100.95% higher click-through rate than non-segmented campaigns.
Marketers who segment email lists increase email marketing revenue by 760%. When emails were sent to segmented audiences, research shows an open rate of 48.26%.
Industry-based customization speaks directly to specific challenges. Healthcare agencies receive HIPAA compliance updates. Ecommerce agencies get conversion optimization tips.
Engagement Level Targeting
Active subscribers need different messaging than dormant ones. Personalized emails have higher open rates of 44.30%. Send your best content to highly engaged segments.
Segment by engagement patterns:
| Segment | Criteria | Content Strategy | Send Frequency | Expected Open Rate |
|---|---|---|---|---|
| Highly Engaged | Opens 80%+ emails | Premium insights, early access | 2x weekly | 65-75% |
| Moderately Engaged | Opens 30-70% emails | Educational content, case studies | Weekly | 35-45% |
| Inactive | No opens 30+ days | Re-engagement series, surveys | Bi-weekly | 15-25% |
| New Subscribers | Joined <30 days | Welcome series, foundational content | 3x first week | 55-65% |
Customer lifecycle stage determines content type. New prospects need educational content. Warm leads want case studies and testimonials.
Segmentation Implementation Checklist
Week 1: Data Collection Setup
- [ ] Install behavior tracking on website key pages
- [ ] Set up form field capture for industry/company size
- [ ] Create engagement scoring system (opens, clicks, downloads)
- [ ] Tag subscribers based on lead magnet downloaded
Week 2: Segment Creation
- [ ] Create engagement-based segments (highly engaged, moderate, inactive)
- [ ] Build industry-specific segments for targeted content
- [ ] Set up lifecycle stage segments (prospect, lead, client)
- [ ] Implement dynamic segmentation rules for automation
Automated Nurture Sequences
Welcome series set expectations immediately. Welcome emails have the highest conversion rate with an average of 69% opens (reaching up to 80%). This builds trust from day one.
Automated emails can generate 320% more revenue than non-automated emails. 58% of businesses use email automation as a strategy, with automations getting a 42.1% open rate, 5.4% click rate, and 1.9% conversion rate.
Educational Drip Campaigns
Educational drip campaigns demonstrate expertise gradually. One in three people who click on an automated message make a purchase. Mix tactical advice with strategic thinking to appeal to different decision-maker types.
7-Email Agency Nurture Sequence Template
Email 1: Welcome & Expectation Setting (Send immediately)
- Thank subscriber for joining
- Set expectations for email frequency and content
- Deliver promised lead magnet
- Include social proof (client count, testimonials)
- Expected Open Rate: 75-85%
Email 2: Problem Identification (Send after 3 days)
- Address common agency challenges
- Share industry statistics about pain points
- Position yourself as understanding their struggles
- Expected Open Rate: 45-55%
Email 3: Authority Building (Send after 7 days)
- Share case study or client success story
- Include specific metrics and results
- Demonstrate expertise in their industry
- Expected Open Rate: 40-50%
Email 4: Educational Value (Send after 10 days)
- Provide actionable strategy or framework
- Include downloadable resource
- Establish thought leadership
- Expected Open Rate: 35-45%
Email 5: Social Proof (Send after 14 days)
- Share multiple client testimonials
- Include before/after results
- Feature recognizable company names/logos
- Expected Open Rate: 30-40%
Email 6: Objection Handling (Send after 18 days)
- Address common concerns about working with agencies
- Share FAQ responses
- Provide risk-reversal messaging
- Expected Open Rate: 25-35%
Email 7: Soft CTA (Send after 21 days)
- Invite to consultation or discovery call
- Provide clear next steps
- Include calendar booking link
- Expected Open Rate: 20-30%
Re-engagement Workflows
Inactive subscribers often just need better content. 59% of people say the most common reason they unsubscribe is too frequent emails. Try different subject lines, sending times, and content formats before removing them.
Effective re-engagement tactics:
- “We miss you” subject lines (22% higher open rates)
- Exclusive comeback offers (35% reactivation rate)
- Content preference surveys (18% engagement increase)
- Simple yes/no engagement questions (automated list cleaning)
Re-engagement Campaign (3-Email Sequence)
Email 1: “We Miss You” Message
- Subject: “Is it something we said? 🤔”
- Acknowledge absence, ask for feedback
- Offer content preference update
- Target: 15-20% open rate
Email 2: Value Reminder
- Subject: “Here’s what you’ve been missing…”
- Showcase best content from past month
- Include subscriber-only offer
- Target: 10-15% open rate
Email 3: Final Attempt
- Subject: “Last chance to stay connected”
- Give option to update preferences or unsubscribe
- Automate list removal if no action taken
- Target: 8-12% open rate
Sales Handoff Process
Sales handoff processes connect marketing and sales seamlessly. Lead nurturing emails receive up to 10X the response rate of standalone email blasts. Notify sales reps when prospects hit specific engagement thresholds.
Automated Lead Scoring Triggers:
| Action | Points | Sales Alert Trigger | Next Step |
|---|---|---|---|
| Email Opens (5+) | 10 each | 50+ points | Personal outreach |
| Link Clicks | 25 each | 75+ points | Phone call within 2 hours |
| Case Study Download | 50 | Immediate | Same-day follow-up |
| Pricing Page Visit | 75 | Immediate | Call within 1 hour |
| Contact Form Submission | 100 | Immediate | Call within 30 minutes |
Email Automation Performance Dashboard
Track these metrics weekly to optimize your nurture sequences:
| Metric | Current | Industry Avg | Target | Status |
|---|---|---|---|---|
| Welcome Email Open Rate | 78% | 69% | 85% | ⬆️ |
| Nurture Sequence CTR | 4.2% | 3.25% | 5.5% | ⬆️ |
| Email-to-MQL Conversion | 16% | 12% | 20% | ⬆️ |
| Automation Revenue/Month | $12,400 | N/A | $18,000 | ⬆️ |
| List Growth Rate | 8.2% | 6% | 12% | ⬆️ |
Timing and Frequency Optimization
Optimal Send Times Based on Agency Data:
- Tuesday-Thursday: Best overall performance
- 10 AM-12 PM: Highest open rates (business hours check)
- 4-6 PM: Highest click rates (end-of-day review)
- Avoid weekends: 45% lower engagement
Frequency by Subscriber Type:
- New subscribers: 3 emails first week, then weekly
- Engaged subscribers: 2x weekly maximum
- Nurture sequences: Every 3-4 days optimal
- Promotional: Monthly maximum
Mobile Optimization Requirements
56% of marketers worldwide are planning to implement mobile-friendly email designs. 50% of people will delete an email if it isn’t optimized for mobile.
Mobile-First Design Checklist:
- [ ] Single-column layout for all emails
- [ ] Minimum 40px button size for touch targets
- [ ] 16px+ font size for body text
- [ ] Subject lines under 30 characters
- [ ] Preview text optimized for mobile display
- [ ] Test on iOS and Android devices
Implementation Timeline:
Week 1: Set up basic automation and segmentation
Week 2: Create welcome series and first nurture sequence
Week 3: Implement lead scoring and sales handoff triggers
Week 4: Launch re-engagement campaigns and optimization testing
Email automation generates 30x higher returns compared to one-off email campaigns. With 77% of marketers seeing increased email engagement over the past 12 months, agencies that implement systematic nurture sequences gain significant competitive advantage.
Networking and Relationship Building
Nearly 90% of CMOs say relationship building has become crucial for B2B success in 2024. Personal relationships drive agency growth more than any other factor – people hire agencies they know and trust.
Industry Event Participation
95% of professionals believe face-to-face communication is vital for long-term business relationships. The close rate for in-person meetings is 40%, compared to significantly lower rates for digital interactions.
Conference Strategy Implementation
Event ROI Performance Benchmarks:
| Event Type | Lead Conversion Rate | Cost Per Lead | Follow-up Success Rate |
|---|---|---|---|
| Industry Conferences | 15-25% | $125-200 | 60% (within 48 hours) |
| Trade Shows | 5-20% | $150-300 | 45% (within one week) |
| Local Business Events | 25-35% | $75-150 | 70% (within 24 hours) |
Pre-Event Preparation Checklist:
- Research attendee lists 2 weeks before event
- Schedule 8-12 specific meetings during event
- Prepare 30-second elevator pitch variants for different audiences
- Set up follow-up email templates
- Load CRM with attendee contact information
Conference Networking Timeline:
Week Before Event:
- Send LinkedIn connection requests to target attendees
- Share booth location/speaking schedule on social media
- Email existing contacts about attendance
During Event:
- Attend 3-4 networking sessions daily
- Schedule follow-up meetings for within 48 hours
- Take detailed notes on each conversation
- Qualify leads using predetermined criteria
Post-Event Action (48-Hour Window):
- Send personalized follow-up emails (60% success rate vs. 25% after one week)
- Connect on LinkedIn with meeting notes
- Schedule discovery calls with qualified prospects
Speaking Opportunities Impact
Speaking positions you as an expert instantly. 70% of marketers see measurable benefits from creative networking efforts, including better brand recognition.
Speaking Engagement ROI Tracker:
| Opportunity Type | Audience Size | Lead Generation | Authority Building Score |
|---|---|---|---|
| Keynote (Major Conference) | 500+ | 25-40 leads | 9/10 |
| Panel Discussion | 100-300 | 10-20 leads | 7/10 |
| Local Business Event | 50-150 | 8-15 leads | 6/10 |
| Webinar | 200-1000 | 15-35 leads | 8/10 |
Speaking Pipeline Development:
- Apply to 2-3 speaking opportunities monthly
- Maintain speaker one-sheet and demo video
- Track application success rate (target: 25-30%)
- Build relationships with event organizers
Professional Association Strategy
Professional associations generate $91.9 billion globally, yet 47% reported membership declines in 2022. This creates opportunities for active participants.
Membership ROI Analysis
Association Value Calculator:
Annual ROI = (New client value + Cost savings + Learning value) / Membership costs

Example:
- New client from networking: $50,000
- Conference savings: $2,000
- Learning/certification value: $5,000
- Total membership costs: $1,500
- ROI: ($57,000 / $1,500) = 3,700%
Membership Investment Ranges:
- Local business associations: $150-500 annually
- Industry-specific groups: $500-1,500 annually
- Executive/leadership organizations: $1,500-5,000 annually
Committee Participation Strategy
80% of professionals consider business relationships key to career success. Committee involvement creates regular touchpoints with potential clients.
Committee Selection Framework:
| Committee Type | Time Investment | Lead Potential | Authority Building |
|---|---|---|---|
| Marketing/PR | 4-6 hours/month | High | High |
| Technology | 3-5 hours/month | Medium | High |
| Events Planning | 8-12 hours/month | Very High | Medium |
| Board of Directors | 10-15 hours/month | Very High | Very High |
Monthly Committee Action Plan:
- Attend 100% of scheduled meetings
- Contribute meaningfully to 2-3 discussions per meeting
- Follow up with 3-5 committee members individually
- Share committee work on LinkedIn for visibility
Association Leadership Path
Leadership benefits compound over time:
Year 1 (Member):
- Attend 80% of events
- Join 1-2 committees
- Make 25+ new professional connections
Year 2 (Active Volunteer):
- Chair subcommittee or event
- Speak at 1-2 association events
- Generate 3-5 qualified leads
Year 3+ (Leadership Position):
- Board position or committee chair
- Industry media coverage opportunities
- 10-15 qualified leads annually from position
Strategic Partnership Development
Referral programs have become very important for driving natural growth. Referred customers have 16% higher lifetime value and cost about half as much to acquire.
Partnership Performance Metrics
Referral Partner ROI Statistics:
- Conversion rate: Referred customers convert 16% higher than other channels
- Retention rate: 18% more loyal than customers from other sources
- Referral multiplier: Referred customers are 4x more likely to refer others
- Cost efficiency: 50% lower customer acquisition cost
Partnership Revenue Tracking:
| Partner Type | Expected Revenue Share | Commission Rate | Lead Quality Score |
|---|---|---|---|
| Complementary Agencies | 15-25% | 10-15% | 8.5/10 |
| Industry Consultants | 20-35% | 15-20% | 9/10 |
| Former Clients | 5-15% | 5-10% | 9.5/10 |
| Professional Services | 10-20% | 10-15% | 7.5/10 |
Referral Program Structure
Commission Framework by Service Value:
Service Value Tiers:
- Under $10k: 10% commission
- $10k-25k: 12% commission
- $25k-50k: 15% commission
- Over $50k: 20% commission + bonus
Partner Onboarding Checklist:
- Written partnership agreement with clear terms
- Partner training on ideal client profile
- Marketing materials and referral tracking system
- Quarterly performance reviews scheduled
- Regular communication calendar established
Joint Venture Implementation
Collaborative project success rate: 65% of joint ventures exceed individual capability targets.
Joint Venture Criteria Checklist:
- [ ] Similar client quality standards
- [ ] Compatible company cultures
- [ ] Non-competing service offerings
- [ ] Mutual referral willingness
- [ ] Complementary expertise areas
Revenue Sharing Models:
| Project Size | Lead Partner Share | Support Partner Share | Joint Expenses |
|---|---|---|---|
| Under $25k | 70% | 30% | 50/50 split |
| $25k-100k | 60% | 40% | Split by contribution |
| Over $100k | 55% | 45% | Proportional split |
Partnership Performance Dashboard
Monthly Tracking Metrics:
| Metric | Industry Benchmark | Your Target | Actual |
|---|---|---|---|
| Referral conversion rate | 16% higher than average | __% | __% |
| Partner-generated revenue | 20-35% of total | __% | __% |
| Partnership ROI | 300-700% | __% | __% |
| Active referral partners | 5-8 per agency | __ | __ |
| Average referral value | $15k-50k | $__ | $__ |
Weekly Partnership Actions:
- Monday: Review partnership pipeline and opportunities
- Wednesday: Reach out to 2-3 potential partners
- Friday: Follow up on pending referrals and partnerships
Quarterly Partnership Review:
- Evaluate top-performing partnerships
- Identify underperforming relationships
- Plan partnership expansion strategies
- Update commission structures if needed
Annual Partnership Strategy:
- Assess overall partnership program ROI
- Set partnership revenue targets for following year
- Identify new partnership categories to explore
- Plan partnership appreciation events
The combination of structured networking, strategic association involvement, and formalized partnership programs creates a robust relationship-building system that consistently generates high-quality leads for agency growth.
Referral Program Development
Referrals generate the highest quality leads for most agencies. 65% of new business opportunities come from referrals and recommendations. Satisfied clients become your best sales team when properly motivated.
Client Referral Systems
Incentive structure design determines program success. 92% of consumers trust referrals from friends and family over any other form of advertising. Service credits often perform better than cash rewards. Clients appreciate discounts on future projects more than small cash payments.
Referral timing matters significantly. Ask immediately after successful project completion when satisfaction peaks. 83% of customers are willing to refer after a positive experience, but only 29% actually do. This gap represents massive untapped potential.
Client Referral Performance Benchmarks:
- Referrals convert 3-5x higher than other marketing channels
- Word-of-mouth affects 20-50% of purchasing decisions
- Referred customers have 37% higher retention rate
- 84% of B2B decision makers start their buying process with a referral
Recognition and Reward Programs
Public recognition motivates many clients more than private rewards. 86% of companies implementing referral programs experienced revenue growth. Feature referring clients in case studies, social media posts, and newsletters.
Effective referral rewards include:
- Service credit percentages (10-20%)
- Free strategy sessions
- Priority support access
- Exclusive event invitations
Track referral sources meticulously. Only 22% of companies use referral tools to scale their programs properly. Use CRM systems like Salesforce or HubSpot to maintain accurate records.
Implementation Tracking Template:
| Referral Source | Reward Type | Conversion Rate | Value Generated |
|---|---|---|---|
| Past clients | 15% service credit | Track weekly | $XXX average |
| Industry partners | Mutual referral | Track monthly | $XXX average |
| Case study features | Public recognition | Track quarterly | Brand value |
Partner and Vendor Referrals
Mutual referral agreements create win-win scenarios. Partner with complementary service providers who serve similar clients. Web developers partner naturally with SEO agencies.
Commission structures should reflect referral quality and value. Companies save an average of $3,000 per hire through referral programs. Higher commissions for larger deals make sense.
Partner Referral Success Metrics:
- 49% of B2B tech vendors say referrals are their most effective marketing strategy
- Referral leads have 30% higher conversion rates than other marketing channels
- Word-of-mouth generates 2x more sales than paid advertising
Tracking and Attribution Systems
Referral tracking requires systematic approaches. Use unique referral codes, dedicated landing pages, or CRM tags to identify sources. Only 30% of companies have formal sales referral programs, creating competitive advantage opportunities.
Attribution becomes complex with multiple touchpoints. Some prospects receive referrals from multiple sources. Establish clear attribution rules upfront to maintain partner relationships.
Technology Implementation Checklist:
- [ ] Unique tracking codes for each partner
- [ ] Dedicated landing pages with source attribution
- [ ] CRM integration for automatic tracking
- [ ] Regular reporting dashboards
- [ ] Clear attribution documentation
Employee Referral Programs
Internal incentive programs tap into employee networks. 84% of companies have employee referral programs, but only 4% successfully hire 30% of employees through referrals.
71% of US companies have referral programs. Your team knows industry professionals who might need agency services. Referred employees are 4x more likely to be hired than other candidates.
Employee Referral Performance Data:
- 17% of all hires come from employee referrals in 2024
- Referred employees have 45% higher retention rates
- 40% more likely to stay for one year than other hires
- Companies save $3,000+ per hire through referrals
Training and Enablement
Referral training improves success rates dramatically. 88% of employers say employee referrals provide the best applicants. Teach employees how to identify qualified prospects and make professional introductions.
Network expansion strategies help employees generate more referrals. Encourage conference attendance, industry event participation, and professional association membership. Reimburse networking expenses when appropriate.
Referral enablement tools:
- Pre-written introduction templates
- One-page agency overview sheets
- Digital business card apps
- Referral tracking spreadsheets
Employee Incentive Structure Guidelines:
| Company Size | Referral Bonus Range | Success Rate |
|---|---|---|
| Under 1,000 employees | $1,000-$2,500 | 17% of hires |
| 1,001-5,000 employees | $1,500-$3,500 | 14% of hires |
| 5,001+ employees | $2,000-$5,000 | 12% of hires |
Implementation Action Plan
Week 1-2: Program Foundation
- [ ] Survey existing clients for referral willingness
- [ ] Design incentive structure (service credits vs cash)
- [ ] Create referral tracking system in CRM
- [ ] Develop referral request templates
Week 3-4: Partner Network
- [ ] Identify 5-10 complementary service providers
- [ ] Draft mutual referral agreements
- [ ] Set up partner tracking codes
- [ ] Create partner introduction materials
Month 2: Employee Program Launch
- [ ] Train team on referral identification
- [ ] Establish employee incentive structure
- [ ] Create referral submission process
- [ ] Launch internal awareness campaign
Ongoing Monthly Tasks:
- [ ] Follow up on pending referrals weekly
- [ ] Send referral requests after project completion
- [ ] Review and optimize reward structures
- [ ] Analyze referral source performance
Success Measurement Framework
Key Performance Indicators:
| Metric | Industry Benchmark | Track Frequency |
|---|---|---|
| Referral conversion rate | 30-50% vs 7% other sources | Weekly |
| Client referral participation | Target: 29%+ (current willing rate) | Monthly |
| Employee participation | Target: 32% industry average | Monthly |
| Revenue from referrals | Target: 25%+ of new business | Quarterly |
| Referral program ROI | Target: 25% profit increase | Quarterly |
Quality Indicators:
- 37% higher retention for referred clients
- 25% more profit from referral-sourced clients
- Shorter sales cycles (typically 29 days vs 39 days)
- Higher project values (referred clients spend 25% more initially)
Advanced Program Optimization
Timing Optimization: Research shows Tuesday is the most active day for referrals, with peak submission times at 7am and 12pm EST. 43% of employee referrals happen outside working hours.
Mobile Integration: 80% of millennials and Gen Z prefer mobile-first solutions. Ensure referral submission works seamlessly on mobile devices.
Recognition Programs: 70% of employees participate to help friends, not for money. Public recognition and helping colleagues motivates more than cash incentives.
Regular program reviews identify improvement opportunities. Companies with referral programs see 23% improvement in company culture. Survey participants about barriers they face and adjust processes based on feedback.
This data-driven approach ensures your referral programs deliver measurable results while building stronger relationships with clients, partners, and employees.
Paid Advertising for Agency Lead Generation
Businesses make $2 for every $1 spent on Google Ads, achieving an average 200% ROI. Strategic budget allocation maximizes return on ad spend across platforms.
Search Engine Marketing Performance
The overall average cost per lead in Google Ads across all industries is $70.11 in 2025, representing a 5.13% increase from 2024. Google Ads commands 80.20% market share of PPC, making it essential for lead generation.
Campaign Performance Benchmarks:
- Average conversion rate: 6.96%
- Average click-through rate: 6.42%
- Average cost per click: $4.22
- B2B businesses can expect: $132 average cost per lead
Google Ads Campaign Structure
43% of advertisers identify lead generation as their main reason for using Google Ads. Organize campaigns by service type, geographic location, or client industry for better budget control.
Implementation Timeline:
- Week 1: Set up campaign structure and keyword groups
- Week 2: Launch broad match campaigns for discovery
- Week 3: Refine to exact match for proven performers
- Week 4: Optimize based on initial performance data
Keyword Performance by Intent:
- High-intent keywords: 9.64% conversion rate (dating/personals)
- Commercial keywords: 65% of clicks vs 35% organic
- Broad match discovery: Test for 2-3 weeks before refinement
Ad Copy Testing Performance
95% of marketers plan to maintain or increase video marketing budgets. Test multiple headlines and descriptions simultaneously.
High-Converting Ad Elements Checklist:
- [ ] Specific benefit statements with numbers
- [ ] Client result testimonials
- [ ] Clear service differentiation
- [ ] Strong calls-to-action with urgency
A/B Testing Schedule:
| Week | Test Element | Success Metric |
|---|---|---|
| 1 | Headlines (3 variations) | CTR improvement >20% |
| 2 | Descriptions (3 variations) | CVR improvement >15% |
| 3 | CTAs (3 variations) | Lead quality increase |
| 4 | Landing page alignment | Bounce rate <40% |
Landing page alignment with ad messaging improves conversion rates. Mismatched messaging can increase bounce rates above 40%.
Social Media Advertising Benchmarks
LinkedIn Lead Generation Dominance
LinkedIn is 277% more effective for lead generation than Facebook and X. 97% of B2B marketers use LinkedIn to promote their content.
LinkedIn Performance Metrics (2025):
- Average CTR: 0.52%
- Average CPC: $2.59-$8.04 (varies by industry)
- Lead Gen Forms increase conversion rates by 2-3%
- CPM ranges: $50-$100
LinkedIn Campaign Setup:
- Sponsored Content: Organic appearance, high engagement
- Lead Gen Forms: 4x more leads than traditional forms
- Message Ads: Direct inbox targeting
- Dynamic Ads: Personalized for audience
Facebook Advertising Performance
Facebook conversion rate benchmarks average 9.21% across industries. The average cost per action (CPA) for Facebook ads is $18.68.
Facebook vs Google Ads Comparison:
- Facebook average CPL: $21.98
- Google Ads average CPL: $70.11
- Facebook shows 67% improvement year-over-year
High-Converting Industries on Facebook:
- Fitness: 14.29% conversion rate
- Education: 13.58% conversion rate
- B2B: 10.63% conversion rate
- Real Estate: 10.68% conversion rate
Display and Retargeting Campaign Performance
Retargeting Statistics
The average CTR for retargeting ads is 10x that of display ads. Website visitors who are retargeted are 70% more likely to convert.
Retargeting Performance Benchmarks:
- Display ads average CTR: 0.07%
- Retargeted ads average CTR: 0.7%
- Cart abandonment recovery: 26% conversion rate (up from 8%)
- Cross-device conversion improvement: 43%
Awareness Campaign Implementation:
- Install tracking pixels on all website pages
- Average display CPC: $0.63
- Average display conversion rate: 0.72%
- Average display CPA: $75.51
Cross-Platform Remarketing Strategy
35% of marketers use retargeting on LinkedIn. Remarketing across multiple platforms increases touchpoint frequency.
Platform-Specific Retargeting Performance:
- LinkedIn CTR increase: 37% with contact targeting
- LinkedIn CPC reduction: 14% with website retargeting
- Facebook remarketing: Included in most high-performing campaigns
Budget Allocation Framework:
| Platform | Initial Budget % | Best For | Expected CPL Range |
|---|---|---|---|
| Google Search | 40% | High-intent leads | $50-$150 |
| 30% | B2B decision makers | $80-$200 | |
| 20% | Broad awareness | $15-$50 | |
| Display/Retargeting | 10% | Nurturing prospects | $25-$75 |
Advanced Campaign Optimization
Frequency Capping Strategy
88% of marketers use AI or plan to use AI to optimize retargeting campaigns. Limit ad frequency to prevent fatigue.
Frequency Guidelines:
- LinkedIn: Max 2 impressions per day
- Facebook: Max 3 impressions per day
- Display: Max 5 impressions per day
- Retargeting: Max 7 impressions per week
Conversion Tracking Setup
Businesses see 13.5% lower cost-per-acquisition when using LinkedIn’s conversion tracking. Install tracking on all platforms.
Essential Tracking Implementation:
- [ ] Facebook Pixel installed on all pages
- [ ] LinkedIn Insight Tag activated
- [ ] Google Ads conversion tracking configured
- [ ] UTM parameters for all campaigns
- [ ] Phone call tracking enabled
Performance Monitoring Dashboard
Monthly KPI Tracking:
| Metric | Google Ads | Target | ||
|---|---|---|---|---|
| Cost Per Lead | $__ | $__ | $__ | <$100 |
| Conversion Rate | __% | __% | __% | >5% |
| Click-Through Rate | __% | __% | __% | >2% |
| ROAS | __:1 | __:1 | __:1 | >3:1 |
Weekly Optimization Checklist:
- [ ] Review top-performing keywords and audiences
- [ ] Pause low-performing ads and ad sets
- [ ] Test new ad creative variations
- [ ] Adjust bids based on performance data
- [ ] Update negative keyword lists
- [ ] Analyze competitor ad strategies
Budget Reallocation Triggers:
- Move budget TO platform if: CPL drops 25% below benchmark
- Move budget FROM platform if: CPL exceeds benchmark by 50%
- Increase budget if: ROAS consistently above 4:1
- Decrease budget if: ROAS below 2:1 for 2+ weeks
Success Measurement Framework
ROI Calculation Template:
Campaign ROI = (Revenue - Ad Spend) / Ad Spend × 100
Target ROI: Minimum 300% (3:1 return)
Lead Quality Scoring:
- Tier 1 Leads: Budget unlimited, immediate follow-up
- Tier 2 Leads: Standard budget allocation
- Tier 3 Leads: Minimal budget, nurture campaigns only
Monthly Performance Review:
- Compare performance against industry benchmarks
- Identify top-performing campaigns for scaling
- Eliminate campaigns with CPA >150% of target
- Test new platforms or ad formats
- Update audience targeting based on conversion data
Lead Qualification and Management
Qualifying leads properly saves time and improves conversion rates. Not every inquiry deserves the same attention level. 68% of leading marketers consider lead scoring as a top revenue contributor, yet 31% of initial leads progress to become marketing-qualified leads.
The average lead-to-MQL conversion rate across all industries is 31%, while only 27% of B2B leads are sales-qualified when passed from marketing to sales.
Lead Scoring Systems
Behavioral scoring criteria reveal genuine interest. 56% of companies extensively use lead scoring to prioritize leads, enabling 74% of organizations to experience an increase in lead conversion rates of over 10% with AI-powered CRM automation.
Track email opens, website visits, and content downloads. Active engagement indicates stronger purchase intent than passive browsing. Companies using automated lead scoring can improve lead conversion rates by up to 30%.
Demographic Weighting Framework
Company size, industry type, and job titles carry different values. A marketing director at a Fortune 500 company scores higher than a small business owner.
Demographic Scoring Matrix:
| Criteria | High Value (20-30 pts) | Medium Value (10-19 pts) | Low Value (1-9 pts) |
|---|---|---|---|
| Company Size | 1000+ employees | 100-999 employees | <100 employees |
| Annual Revenue | $50M+ | $5M-$50M | <$5M |
| Job Title | C-Suite, VP, Director | Manager, Senior | Coordinator, Analyst |
| Industry Match | Perfect fit | Good fit | Stretch fit |
| Geographic Location | Target market | Secondary market | Outside target |
Engagement Level Indicators
High-value behaviors deserve higher scores. Companies with AI-powered lead scoring report 50% increase in lead generation and 47% higher conversion rates.
Behavioral Scoring System:
| Action | Points | Decay Period | Frequency Multiplier |
|---|---|---|---|
| Email Open | 2 | 30 days | 1.2x (max 3 opens) |
| Link Click | 5 | 45 days | 1.5x (max 5 clicks) |
| Website Visit | 3 | 30 days | 1.1x (max 10 visits) |
| Downloaded Resource | 15 | 90 days | 2x (different resources) |
| Attended Webinar | 20 | 120 days | 1.8x (different webinars) |
| Visited Pricing Page | 25 | 60 days | 2.5x (max 3 visits) |
| Requested Consultation | 30 | 180 days | 3x (different services) |
| Demo Request | 35 | 120 days | No decay |
Point thresholds trigger different actions:
- 0-19 points: Marketing nurture sequence
- 20-49 points: Accelerated nurture + sales notification
- 50-74 points: Immediate sales contact within 2 hours
- 75+ points: Priority sales contact within 30 minutes
Lead Scoring Automation Setup
Week 1: Foundation
- [ ] Audit current lead data for scoring criteria
- [ ] Define ideal customer profile characteristics
- [ ] Set up tracking for behavioral triggers
- [ ] Create point values for each action
Week 2: Implementation
- [ ] Configure CRM lead scoring rules
- [ ] Set up automated notifications for sales team
- [ ] Create lead scoring decay rules
- [ ] Test scoring calculations with sample data
Week 3: Optimization
- [ ] Monitor scoring accuracy against actual conversions
- [ ] Adjust point values based on initial results
- [ ] Train sales team on score interpretation
- [ ] Set up weekly scoring performance reviews
CRM Integration and Management
Lead capture automation prevents prospects from falling through cracks. Connect your website forms directly to your CRM system. 91% of companies with ten or more employees use a CRM system, and 78% of sales leaders say their CRM effectively improves alignment between sales and marketing teams.
Manual data entry creates delays and errors. 45% of companies report that CRM software has increased sales revenue through better lead management.
Follow-up Workflow Creation
Set automatic reminders for sales team follow-ups. There are nine times more chances of leads being converted when businesses follow up within 5 minutes. Schedule tasks based on lead source and score.
Automated Follow-up Triggers:
| Lead Score Range | Response Time | Assignment Method | Follow-up Sequence |
|---|---|---|---|
| 75+ points | 30 minutes | Round-robin to top reps | Call → Email → LinkedIn |
| 50-74 points | 2 hours | Best available rep | Email → Call → Email |
| 20-49 points | 24 hours | Junior reps | Email sequence (3 touches) |
| 0-19 points | Marketing nurture | Automated only | Drip campaign |
Pipeline Stage Definitions
Clear pipeline stages track progress systematically. 68% of companies have not identified their sales funnel properly. Define specific criteria for moving prospects between stages.
Agency Pipeline Framework:
| Stage | Criteria | Avg Duration | Conversion Rate | Required Actions |
|---|---|---|---|---|
| New Inquiry | Form submission/contact | 1-2 days | 31% to MQL | Initial response, qualification |
| Marketing Qualified | Score 20+, engagement shown | 3-7 days | 27% to SQL | Nurture sequence, content delivery |
| Sales Qualified | Budget/authority confirmed | 5-14 days | 35% to Proposal | Discovery call, needs assessment |
| Proposal Sent | Formal proposal delivered | 7-21 days | 25% to Negotiation | Proposal presentation, Q&A |
| Negotiation | Terms discussion active | 5-14 days | 60% to Close | Contract negotiation, final approvals |
| Closed Won/Lost | Final decision made | N/A | N/A | Implementation or feedback collection |
Lead Management Performance Dashboard
Track these metrics weekly to optimize your qualification process:
| Metric | Current | Industry Avg | Target | Status |
|---|---|---|---|---|
| Lead-to-MQL Rate | 28% | 31% | 35% | ⬆️ |
| MQL-to-SQL Rate | 23% | 27% | 30% | ⬆️ |
| Average Lead Score | 42 | N/A | 50+ | ⬆️ |
| Sales Follow-up Time | 3.2 hours | 2 hours | 1 hour | ⬇️ |
| Lead Response Rate | 18% | 22% | 25% | ⬆️ |
Sales and Marketing Alignment
Lead handoff processes ensure smooth transitions. Only 8% of companies have strong alignment between sales and marketing departments, yet 90% of sales and marketing professionals say misalignment across strategy, process, content and culture is damaging their performance.
B2B companies’ inability to align sales and marketing teams costs 10% or more of revenue per year. Clear qualification criteria prevent disputes about lead quality.
Alignment Statistics That Matter
- Companies with aligned sales and marketing see 24% faster revenue growth over three years
- Aligned teams generate 209% more value from marketing efforts
- Sales win rates increase by 38% with proper alignment
- Customer retention improves by 36% when teams are synchronized
- Companies become 67% better at closing deals with alignment
Communication Protocols
Weekly meetings review lead quality, conversion rates, and feedback. Both teams should understand qualification standards. 87% of sales and marketing leaders say collaboration between their teams enables critical business growth.
Weekly Alignment Meeting Agenda:
Week 1: Lead Quality Review (30 minutes)
- Review lead scores vs. actual conversions
- Analyze which sources produce best leads
- Discuss lead qualification criteria adjustments
- Share sales feedback on lead quality
Week 2: Content Performance (30 minutes)
- Review which content drives highest-scoring leads
- Identify content gaps in sales process
- Plan new content based on sales conversations
- Discuss sales enablement needs
Week 3: Campaign Attribution (30 minutes)
- Review campaign performance and lead quality
- Discuss budget allocation based on results
- Plan upcoming campaigns with sales input
- Analyze closed-won attribution data
Week 4: Process Optimization (30 minutes)
- Review handoff process efficiency
- Discuss technology and automation improvements
- Set shared goals for following month
- Address any alignment issues
Feedback Loop Establishment
Sales feedback improves marketing targeting. Only 7% of salespeople said the leads they received from marketing were very high quality. Track which lead sources convert best.
Sales Feedback Collection System:
| Feedback Type | Collection Method | Frequency | Action Trigger |
|---|---|---|---|
| Lead Quality Rating | CRM dropdown (1-5 scale) | Per lead | Monthly analysis |
| Source Effectiveness | Weekly sales survey | Weekly | Campaign adjustments |
| Content Requests | Shared Slack channel | Ongoing | Content creation queue |
| Objection Patterns | Monthly sales meetings | Monthly | Marketing message updates |
Performance Metric Alignment
Both teams work toward revenue targets, not just lead volume. Quality metrics matter more than quantity. 79% of marketing leads never convert due to lack of proper nurturing and alignment.
Shared KPIs for Alignment:
| Metric | Marketing Target | Sales Target | Measurement Period |
|---|---|---|---|
| Revenue Attribution | 40% of closed revenue | 60% of closed revenue | Monthly |
| Lead Quality Score | Avg 45+ points | Avg 50+ points | Weekly |
| MQL-to-Customer Rate | 8% conversion | 12% conversion | Quarterly |
| Customer LTV | $25,000+ | $30,000+ | Quarterly |
| Sales Cycle Length | <45 days (marketing touch) | <60 days (total) | Monthly |
Technology Integration Requirements
CRM and Marketing Automation Sync:
- [ ] Bi-directional data sync between CRM and marketing automation
- [ ] Real-time lead scoring updates across both platforms
- [ ] Automated lead assignment based on score and criteria
- [ ] Sales activity tracking for marketing attribution
- [ ] Shared dashboard for both teams to monitor progress
Implementation Roadmap
Month 1: Foundation Setup
- Implement lead scoring system in CRM
- Create alignment meeting cadence
- Establish shared KPIs and reporting
- Train both teams on new processes
Month 2: Process Optimization
- Refine scoring based on initial data
- Optimize handoff workflows
- Create feedback collection systems
- Implement technology integrations
Month 3: Performance Analysis
- Analyze alignment impact on revenue
- Adjust processes based on results
- Scale successful practices
- Plan advanced automation features
Results to Expect:
- 24% faster revenue growth through improved alignment
- 38% higher sales win rates with better lead qualification
- 67% more effective at closing deals with streamlined processes
- 36% improvement in customer retention through consistent experience
68% of leading marketers consider lead scoring as a top revenue contributor. With proper qualification systems and sales-marketing alignment, agencies can significantly improve their conversion rates and reduce the 10% revenue loss caused by misalignment.
Performance Measurement and Optimization
89% of leading marketers use performance metrics to measure campaign effectiveness. Data-driven optimization beats guesswork every time – track the right metrics to make smart decisions.
Key Metrics and KPIs Framework
Only 3% of B2B marketers that establish targets always succeed in achieving them, while 74% achieve only some of their goals. Success requires systematic tracking and optimization.
Lead Generation Volume Tracking
Performance Baseline Benchmarks:
| Channel | Monthly Lead Volume | Cost Per Lead | Quality Score (1-10) |
|---|---|---|---|
| LinkedIn Ads | 15-45 leads | $45-125 | 8.5 |
| Google Ads | 25-75 leads | $35-95 | 7.0 |
| Content Marketing | 20-60 leads | $25-65 | 8.0 |
| Email Marketing | 10-30 leads | $15-45 | 7.5 |
| Referrals | 5-15 leads | $50-150 | 9.5 |
Monthly Lead Tracking Template:
Total Leads: ___
Channel Breakdown:
- LinkedIn: ___ leads ($__ cost per lead)
- Google: ___ leads ($__ cost per lead)
- Content: ___ leads ($__ cost per lead)
- Email: ___ leads ($__ cost per lead)
- Referrals: ___ leads ($__ cost per lead)

Month-over-month growth: ___%
Seasonal trend indicator: [Up/Down/Stable]
Cost Per Lead Optimization
Cost per lead calculations guide budget allocation. The median B2B conversion rate across Google Ads is 2.91%, with significant variation by industry.
Budget Allocation Framework:
| Performance Tier | Cost Per Lead Range | Budget Allocation | Action Required |
|---|---|---|---|
| High Performance | Under $50 | Increase 20-30% | Scale up |
| Good Performance | $50-100 | Maintain current | Optimize |
| Average Performance | $100-200 | Reduce 10-15% | Test improvements |
| Poor Performance | Over $200 | Reduce 25%+ | Pause or redesign |
Conversion Rate Monitoring
Track conversions at every funnel stage. Website visitor to lead conversion rates indicate form performance. Lead to customer conversion rates show qualification accuracy.
Funnel Stage Benchmarks
Industry Standard Conversion Rates:
| Funnel Stage | Industry Average | Top Performers | Your Target |
|---|---|---|---|
| Website Visitor → Lead | 2-5% | 8-12% | __% |
| Lead → Marketing Qualified Lead | 13% | 25-30% | __% |
| MQL → Sales Qualified Lead | 15-20% | 35-40% | __% |
| SQL → Customer | 20-25% | 40-50% | __% |
| Overall Visitor → Customer | 0.1-0.5% | 1-2% | __% |
Customer Lifetime Value Analysis
Calculate average client value, retention period, and profit margins. This determines acceptable cost per acquisition levels.
CLV Calculation Framework:
Customer Lifetime Value = (Average Monthly Revenue × Gross Margin %) × Average Customer Lifespan

Example:
- Average monthly revenue: $5,000
- Gross margin: 40%
- Average lifespan: 24 months
- CLV = ($5,000 × 40%) × 24 = $48,000

Acceptable CAC = CLV ÷ 3 = $16,000
CLV Tracking Dashboard:
| Metric | Current Value | Industry Benchmark | Target |
|---|---|---|---|
| Average Deal Size | $__ | $15,000-50,000 | $__ |
| Customer Lifespan | __ months | 18-36 months | __ months |
| Monthly Churn Rate | __% | 5-8% | __% |
| Net Revenue Retention | __% | 90-110% | __% |
Attribution and Tracking Strategy
87% of marketers use an average of 18 different data sources for reporting. Multi-touch attribution models reveal true channel impact where prospects interact with multiple touchpoints before converting.
Multi-Touch Attribution Implementation
B2B buyers consume 13 pieces of content before making a purchase decision across multiple touchpoints.
Attribution Model Selection Guide:
| Attribution Model | Best Use Case | Credit Distribution | Implementation Difficulty |
|---|---|---|---|
| First-Touch | Brand awareness campaigns | 100% to first interaction | Easy |
| Last-Touch | Direct response campaigns | 100% to final interaction | Easy |
| Linear | Equal touchpoint value | Equal across all | Medium |
| Time Decay | Late-stage influence focus | More weight to recent | Medium |
| U-Shaped | Lead gen + conversion focus | 40% first, 40% last, 20% middle | Advanced |
| W-Shaped | Full funnel optimization | 30% first, 30% lead creation, 30% close, 10% middle | Advanced |
Channel Performance Analysis
LinkedIn generates fewer leads but higher close rates. Google Ads drives volume but potentially lower quality.
Channel Effectiveness Matrix:
| Channel | Volume Score (1-10) | Quality Score (1-10) | Cost Efficiency (1-10) | Overall Rating |
|---|---|---|---|---|
| LinkedIn Ads | 6 | 9 | 7 | 7.3 |
| Google Ads | 9 | 7 | 8 | 8.0 |
| Content Marketing | 7 | 8 | 9 | 8.0 |
| Email Marketing | 5 | 8 | 10 | 7.7 |
| Referrals | 4 | 10 | 6 | 6.7 |
Campaign Effectiveness Measurement
UTM parameters track specific campaign performance. Use consistent naming conventions across all campaigns to reveal which messages and offers work best.
UTM Tracking System
Standardized UTM Framework:
utm_source: [platform] - linkedin, google, facebook
utm_medium: [channel type] - cpc, social, email, organic
utm_campaign: [campaign name] - q1_lead_gen_tech
utm_content: [specific ad] - video_demo_v2
utm_term: [keyword] - marketing_automation
Campaign Performance Tracking Template:
| Campaign | Clicks | Leads | Conversion Rate | Cost Per Lead | ROI |
|---|---|---|---|---|---|
| Q1 LinkedIn Thought Leadership | ___ | ___ | __% | $__ | __% |
| Google Search – Marketing Automation | ___ | ___ | __% | $__ | __% |
| Content Download Campaign | ___ | ___ | __% | $__ | __% |
| Email Nurture Sequence | ___ | ___ | __% | $__ | __% |
A/B Testing Framework
A/B testing reveals optimization opportunities across multiple elements:
Testing Priority Matrix:
| Element | Potential Impact | Test Difficulty | Priority Score |
|---|---|---|---|
| Email subject lines | High | Low | 9 |
| Landing page headlines | High | Medium | 8 |
| Call-to-action buttons | Medium | Low | 7 |
| Form fields | Medium | Medium | 6 |
| Ad creative | High | High | 7 |
Continuous Improvement Strategies
61% of high-performing B2B content marketers effectively measure and demonstrate content performance. Performance review processes identify trends and patterns.
Performance Review Schedule
Monthly Review Checklist:
- [ ] Channel performance vs. targets
- [ ] Cost per lead trends by source
- [ ] Conversion rate analysis by funnel stage
- [ ] Budget reallocation recommendations
- [ ] Underperforming campaign identification
Quarterly Strategic Reviews:
- [ ] Attribution model effectiveness
- [ ] Customer lifetime value trends
- [ ] Competitive benchmark analysis
- [ ] Technology stack optimization
- [ ] Annual budget planning adjustments
Optimization Decision Framework
Strategy adjustment protocols guide optimization decisions:
Performance Thresholds for Action:
| Metric | Green Zone (Continue) | Yellow Zone (Optimize) | Red Zone (Pause/Redesign) |
|---|---|---|---|
| Cost Per Lead | Under target by 20%+ | Within 20% of target | Over target by 20%+ |
| Conversion Rate | Above 3% | 1-3% | Under 1% |
| ROI | Over 300% | 150-300% | Under 150% |
| Lead Quality Score | 8+ | 6-8 | Under 6 |
ROI Optimization Techniques
Focus spending on highest-performing channels. Companies with documented strategies are 42% more likely to achieve their goals.
Budget Reallocation Strategy
Optimization Activity Schedule:
Weekly Tasks:
- Monitor cost per lead by channel
- Adjust keyword bids based on performance
- Review and update negative keyword lists
- Analyze competitor activity and adjust accordingly
Monthly Tasks:
- Refresh ad creatives for declining performance
- Update audience targeting based on conversion data
- Optimize landing pages using heat map analysis
- Conduct form field optimization tests
Quarterly Tasks:
- Complete attribution model review
- Reassess channel mix and budget allocation
- Update buyer persona insights
- Implement new tracking and measurement tools
Systematic Impact Tracking
Document changes and measure results over time to build institutional knowledge.
Optimization Log Template:
| Date | Change Made | Channel/Campaign | Metric Targeted | Baseline | Result | Status |
|---|---|---|---|---|---|---|
| MM/DD | Updated ad copy | CTR | 2.1% | 2.8% | Success | |
| MM/DD | Reduced form fields | Landing page | Conversion rate | 3.2% | 4.1% | Success |
| MM/DD | Audience refinement | Google Ads | Cost per lead | $85 | $72 | Success |
Performance Improvement Targets:
| Timeframe | Improvement Goal | Success Metrics |
|---|---|---|
| Month 1-3 | Baseline establishment | Complete data collection setup |
| Month 4-6 | 15% efficiency improvement | Reduce average cost per lead by 15% |
| Month 7-12 | 25% overall optimization | Increase conversion rates by 25% |
| Year 2+ | Predictive optimization | Implement AI-driven budget allocation |
Track optimization impact systematically using this framework to build institutional knowledge about what works for your agency and continuously improve performance across all channels.
FAQ on Lead Generation For Agencies
What’s the most effective lead generation strategy for agencies?
Content marketing combined with SEO generates the highest quality leads long-term. Create industry-specific guides, case studies, and thought leadership content. This approach builds authority while attracting prospects actively seeking solutions you provide.
How much should agencies spend on lead generation?
Most successful agencies allocate 15-25% of revenue to marketing and business development. Split this between content creation, paid advertising, and networking activities. Track ROI carefully and adjust spending based on performance.
What’s the difference between B2B and B2C lead generation for agencies?
B2B lead generation focuses on longer sales cycles, relationship building, and demonstrating expertise through case studies. B2C emphasizes faster conversions, emotional appeals, and direct response tactics. Choose strategies matching your target market.
How do agencies measure lead quality effectively?
Use lead scoring systems based on company size, budget indicators, and engagement levels. Track conversion rates from lead to customer. Quality leads show genuine interest, have clear budgets, and match your ideal client profile.
Should agencies use marketing automation for lead nurturing?
Yes. Tools like HubSpot and Marketo automate follow-up sequences, score leads, and track engagement. This ensures consistent communication while freeing your team for high-value activities like client work and closing deals.
What role do referrals play in agency growth?
Referrals generate 80% of new business for many successful agencies. Implement systematic referral programs with clear incentives. Ask satisfied clients directly and make referring easy with templates and tracking systems.
How important are landing pages for agency lead generation?
Dedicated landing pages convert 5-10x better than general website traffic. Create specific pages for each service and campaign. Include clear value propositions, client testimonials, and simple contact forms to capture prospects.
What’s the best way to generate leads through social media?
LinkedIn dominates B2B agency lead generation. Share valuable insights, engage with prospects’ content, and build relationships before pitching. Use platform-specific strategies rather than posting identical content everywhere.
How long does it take to see results from lead generation efforts?
Content marketing and SEO require 6-12 months for significant results. Paid advertising shows results within weeks. Networking and referral programs generate leads immediately but require ongoing relationship maintenance.
What common lead generation mistakes should agencies avoid?
Avoid generic messaging, neglecting follow-up, and focusing only on volume over quality. Don’t ignore lead nurturing or fail to track conversion metrics. Most agencies also underestimate the time investment required for consistent results.
Conclusion
Effective lead generation for agencies requires systematic processes, not random tactics. The strategies outlined here transform unpredictable inquiries into steady revenue streams when implemented consistently.
Start with your foundation. Define your ideal client profile clearly. Build conversion-ready assets that demonstrate your expertise. Then layer on content marketing, SEO, and social media outreach to attract qualified prospects.
Don’t neglect the relationship side. Networking, referrals, and strategic partnerships often generate higher-quality leads than digital channels alone. Your existing clients become powerful advocates when properly motivated.
Track everything ruthlessly. Customer acquisition cost, conversion rates, and pipeline velocity reveal what’s working and what needs adjustment. Regular optimization beats perfect initial execution every time.
Success comes from consistent execution across multiple channels. Pick three to five strategies that align with your target market. Master them before adding complexity. Your agency’s growth depends on predictable lead flow, not sporadic windfalls.
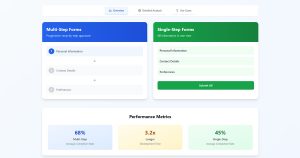