


A blank quiz builder staring back at you is where most people quit. The questions feel off, the scoring logic gets confusing, and the whole thing takes three times longer…
Table of Contents
One badly worded question can ruin months of research work.
Every survey researcher learns this the hard way.
Getting good data comes down to picking the right types of survey questions for what you’re trying to learn. Whether you’re checking customer satisfaction, doing market research, or getting employee feedback, your question format makes or breaks your results.
Most researchers just use basic multiple choice and rating questions.
Big mistake.
This guide walks through survey question types that pros actually use to get real insights. You’ll learn when dropdown beats checkbox questions, how constant sum questions show what people really care about, and why semantic differential beats regular rating scales.
We cover everything from simple demographic questions to fancy MaxDiff analysis.
Each question type works best for different goals.
Once you know what each format does well, you’ll build surveys that give you answers you can actually use instead of useless numbers.
Good survey design is knowing which question fits your specific needs.
Types of Survey Questions
| Question Type | Primary Purpose | Data Collection Focus | Implementation Context |
|---|---|---|---|
| Demographic Questions | Collect respondent classification data | Age, gender, income, education level | Survey introduction or conclusion |
| Customer Satisfaction Questions | Measure service quality perception | Satisfaction ratings, service evaluation | Post-transaction or periodic assessment |
| Net Promoter Score Questions | Assess recommendation likelihood | 0-10 scale loyalty measurement | Customer relationship evaluation |
| Product Feedback Questions | Gather product improvement insights | Feature evaluation, usage patterns | Product development research |
| Brand Awareness Questions | Measure brand recognition levels | Aided/unaided recall, brand association | Marketing campaign effectiveness |
| Purchase Intent Questions | Predict future buying behavior | Likelihood scales, purchase timing | Sales forecasting and planning |
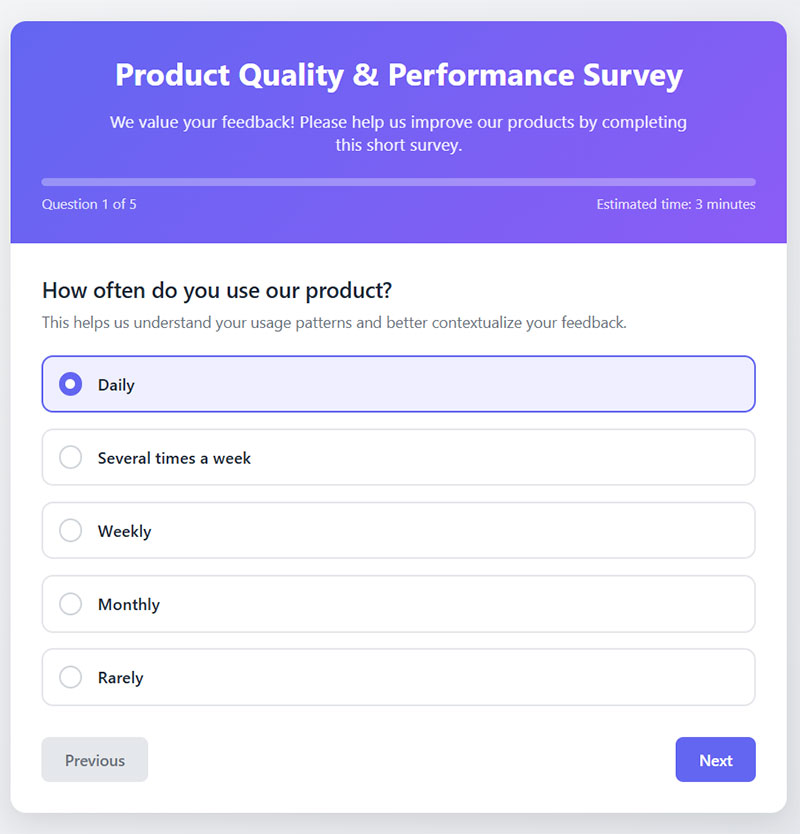
| Usage and Behavior Questions | Understand consumption patterns | Frequency, duration, context of use | User experience optimization |
| Awareness and Knowledge Questions | Test information comprehension | Topic familiarity, understanding depth | Educational content effectiveness |
| Opinion and Attitude Questions | Capture subjective viewpoints | Beliefs, perceptions, sentiment | Public opinion research |
| Preference Questions | Identify choice hierarchies | Ranking, rating, trade-off analysis | Product positioning strategy |
| Importance Questions | Determine priority weightings | Attribute significance, value drivers | Feature development prioritization |
| Frequency Questions | Quantify occurrence rates | Temporal patterns, usage intervals | Behavioral trend analysis |
| Screening Questions | Filter qualified participants | Eligibility criteria, target matching | Survey quality control |
| Post-Event Feedback Questions | Evaluate experience quality | Event satisfaction, improvement areas | Event planning optimization |
| Employee Engagement Questions | Assess workplace satisfaction | Job satisfaction, organizational commitment | Human resources management |
| Market Research Questions | Analyze market conditions | Market size, trends, competition | Strategic business planning |
| Usability Testing Questions | Evaluate interface effectiveness | Task completion, user experience | Product design improvement |
| Price Sensitivity Questions | Determine pricing tolerance | Price thresholds, value perception | Pricing strategy optimization |
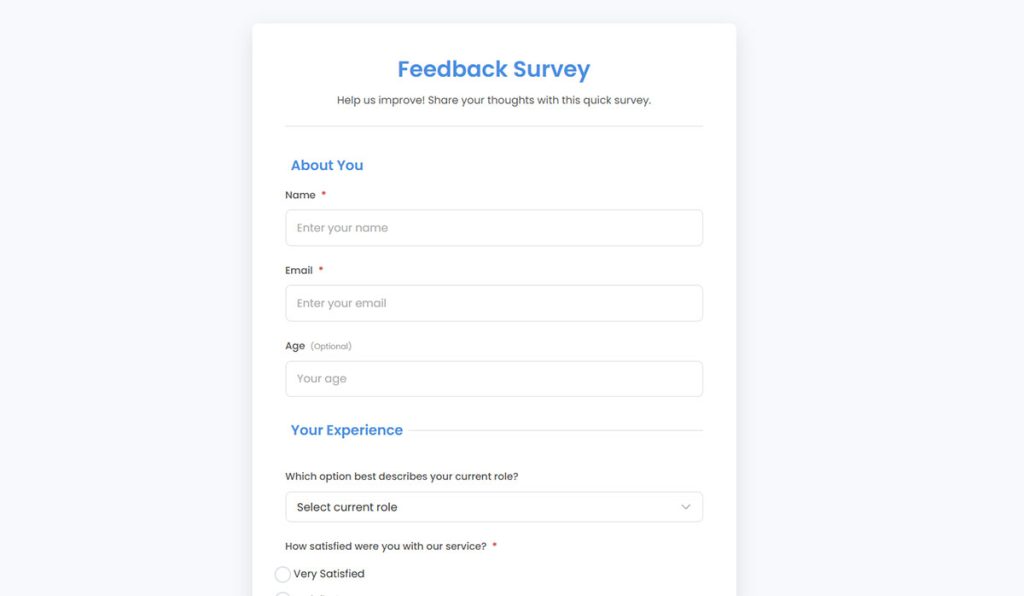
Demographic Questions
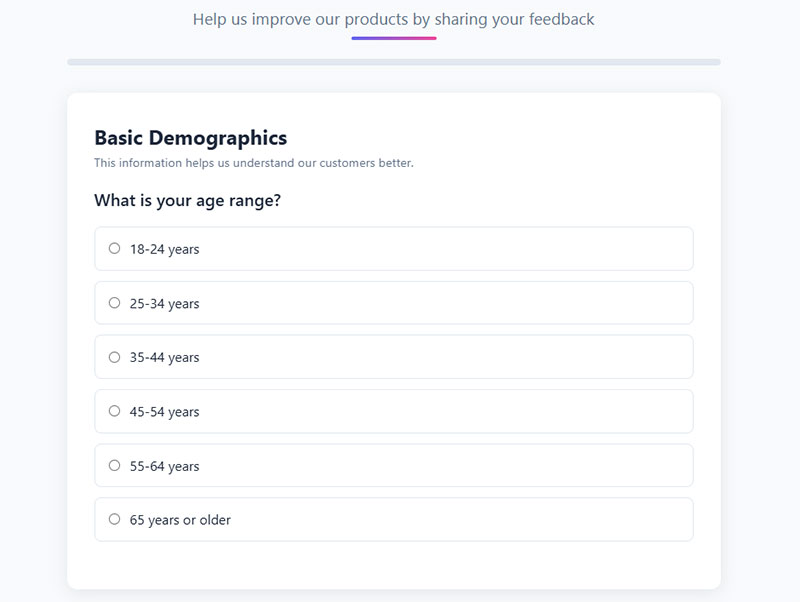
Demographic questions collect measurable characteristics that categorize respondents based on personal attributes like age, gender, income, education, and geographic location.
Core Attributes
- Purpose: Segment audiences for targeted analysis and cross-tabulation comparisons
- Response Format: Multiple choice, dropdown menus, or checkboxes with predefined categories
- Data Type: Quantitative classification data
Implementation Context
- Optimal Use Cases: Market segmentation, buyer persona development, and research validation
- Industry Applications: Healthcare research, political polling, consumer goods, and academic studies
- Sample Size Considerations: Minimum 100 respondents for reliable demographic breakdowns
Technical Specifications
- Validity Measures: Census data comparison and representative sampling protocols
- Reliability Factors: Consistent category definitions across survey administrations
- Bias Mitigation: Include “prefer not to say” options and avoid leading question wording
Analysis Framework
- Statistical Methods: Chi-square tests, cross-tabulation analysis, and correlation studies
- Interpretation Guidelines: Compare percentages across demographic segments for meaningful patterns
- Reporting Standards: Always report confidence intervals and sample size for each demographic group
Customer Satisfaction Questions
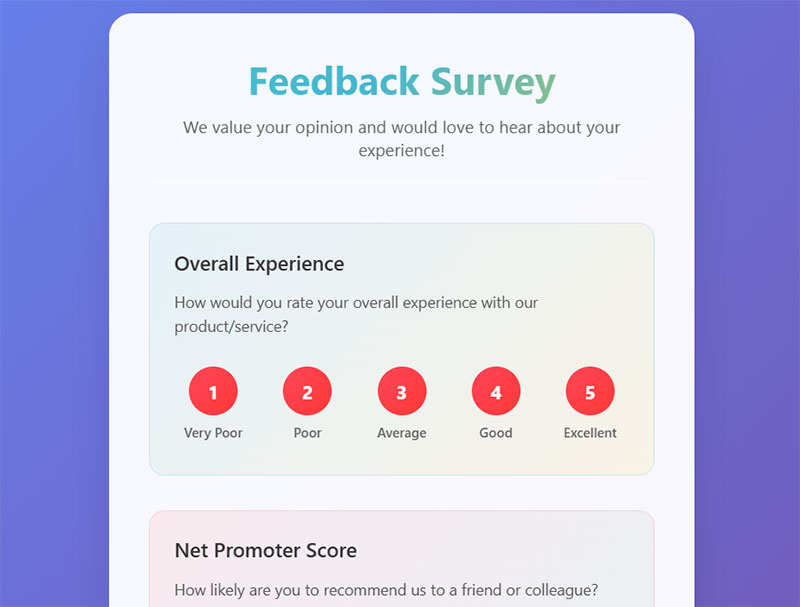
Customer satisfaction questions measure how well products, services, or experiences meet customer expectations using standardized rating scales.
Core Attributes
- Purpose: Evaluate service quality and identify improvement opportunities
- Response Format: 5-point or 7-point Likert scales from “very dissatisfied” to “very satisfied”
- Data Type: Quantitative satisfaction metrics with qualitative context
Implementation Context
- Optimal Use Cases: Post-purchase evaluation, service interaction assessment, and loyalty measurement
- Industry Applications: Retail, hospitality, SaaS, healthcare, and telecommunications
- Sample Size Considerations: 200+ responses for reliable CSAT score calculations
Technical Specifications
- Validity Measures: Correlation with retention rates and repeat purchase behavior
- Reliability Factors: Internal consistency across satisfaction dimensions (Cronbach’s alpha > 0.7)
- Bias Mitigation: Timing surveys close to experience events and avoiding leading language
Analysis Framework
- Statistical Methods: Mean satisfaction scores, variance analysis, and regression modeling
- Interpretation Guidelines: Focus on top-two-box scores (satisfied + very satisfied) for actionable insights
- Reporting Standards: Track trends over time and benchmark against industry standards
Net Promoter Score (NPS) Questions
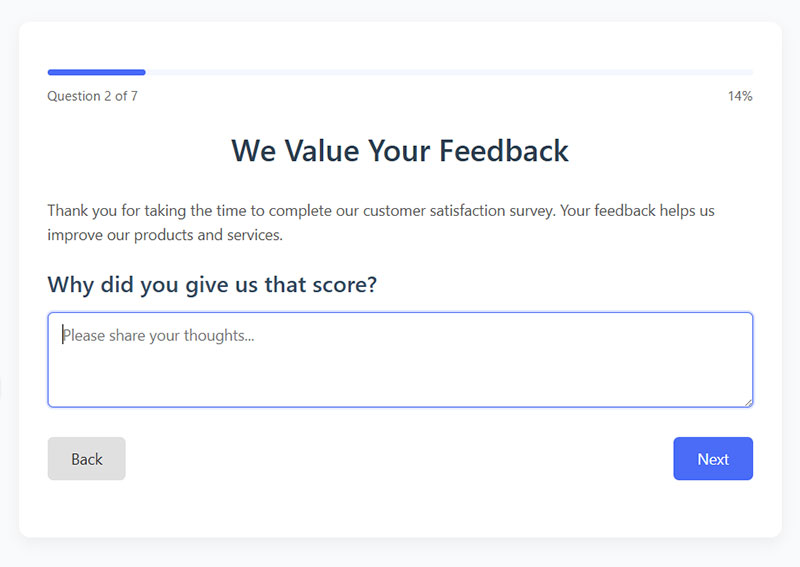
NPS questions measure customer loyalty by asking how likely respondents are to recommend a company, product, or service on a 0-10 scale.
Core Attributes
- Purpose: Predict customer loyalty and identify advocacy potential
- Response Format: Single 11-point scale (0-10) with likelihood-to-recommend framing
- Data Type: Quantitative loyalty metric with categorical segmentation
Implementation Context
- Optimal Use Cases: Quarterly relationship surveys, post-interaction feedback, and competitive benchmarking
- Industry Applications: B2B services, software, financial services, and subscription businesses
- Sample Size Considerations: Minimum 100 responses per measurement period for stable scores
Technical Specifications
- Validity Measures: Correlation with actual referral behavior and customer retention
- Reliability Factors: Consistent question wording and scale presentation across surveys
- Bias Mitigation: Follow-up with open-ended “why” questions for context
Analysis Framework
- Statistical Methods: Percentage calculation (promoters minus detractors), trend analysis
- Interpretation Guidelines: Scores above 50 indicate strong loyalty; negative scores require immediate attention
- Reporting Standards: Report promoter, passive, and detractor percentages alongside overall NPS
Product Feedback Questions
Product feedback questions gather specific input on product features, usability, performance, and overall user experience to guide development decisions.
Core Attributes
- Purpose: Improve product functionality and user satisfaction
- Response Format: Mixed methods including ratings, multiple choice, and open-ended responses
- Data Type: Both quantitative feature ratings and qualitative improvement suggestions
Implementation Context
- Optimal Use Cases: Post-purchase evaluation, beta testing, and feature prioritization research
- Industry Applications: Software development, consumer electronics, manufacturing, and e-commerce
- Sample Size Considerations: 150+ users for statistically significant feature comparisons
Technical Specifications
- Validity Measures: Usage analytics correlation and competitive feature analysis
- Reliability Factors: Consistent terminology and feature definitions across surveys
- Bias Mitigation: Ask about actual usage patterns before satisfaction ratings
Analysis Framework
- Statistical Methods: Feature importance scoring, satisfaction correlation analysis, and sentiment analysis
- Interpretation Guidelines: Prioritize features with high importance but low satisfaction scores
- Reporting Standards: Present findings with usage frequency data and competitive context
Brand Awareness Questions
Brand awareness questions assess recognition, recall, and perception of brand elements including logos, messaging, and market positioning.
Core Attributes
- Purpose: Measure brand recognition levels and competitive positioning effectiveness
- Response Format: Unaided recall, aided recognition, and brand association questions
- Data Type: Categorical awareness levels and qualitative brand perception data
Implementation Context
- Optimal Use Cases: Marketing campaign effectiveness, brand tracking studies, and market entry research
- Industry Applications: Consumer goods, retail, technology, and professional services
- Sample Size Considerations: 400+ respondents for reliable brand awareness percentages
Technical Specifications
- Validity Measures: Purchase behavior correlation and market share alignment
- Reliability Factors: Standardized brand prompts and consistent measurement intervals
- Bias Mitigation: Randomize brand presentation order and use neutral questioning
Analysis Framework
- Statistical Methods: Top-of-mind awareness percentages, aided vs. unaided recall comparisons
- Interpretation Guidelines: Track awareness changes over campaign periods and versus competitors
- Reporting Standards: Report both spontaneous and prompted awareness with confidence intervals
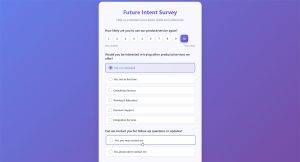
Purchase Intent Questions
Purchase intent questions predict future buying behavior by measuring respondents’ likelihood to purchase products or services within specific timeframes.
Core Attributes
- Purpose: Forecast sales potential and evaluate marketing message effectiveness
- Response Format: Purchase likelihood scales, timeframe specifications, and conditional scenarios
- Data Type: Quantitative intent scores with behavioral prediction modeling
Implementation Context
- Optimal Use Cases: Product launch planning, pricing research, and marketing ROI measurement
- Industry Applications: Retail, automotive, real estate, and subscription services
- Sample Size Considerations: 300+ respondents for accurate intent-to-purchase conversion modeling
Technical Specifications
- Validity Measures: Actual purchase behavior tracking and conversion rate analysis
- Reliability Factors: Consistent timeframe definitions and purchase scenario descriptions
- Bias Mitigation: Include budget and need qualification questions for realistic intent
Analysis Framework
- Statistical Methods: Purchase probability modeling, intent-to-action conversion rates
- Interpretation Guidelines: Weight high-intent responses more heavily in sales forecasting
- Reporting Standards: Present intent scores with confidence intervals and conversion assumptions
Usage and Behavior Questions
Usage and behavior questions document how, when, and why customers interact with products or services to understand consumption patterns.
Core Attributes
- Purpose: Map customer journey touchpoints and identify usage optimization opportunities
- Response Format: Frequency scales, multiple choice selections, and behavioral sequence questions
- Data Type: Quantitative usage metrics and qualitative behavior descriptions
Implementation Context
- Optimal Use Cases: Product development guidance, customer success optimization, and churn prevention
- Industry Applications: SaaS platforms, mobile apps, subscription services, and digital tools
- Sample Size Considerations: 200+ active users for meaningful usage pattern identification
Technical Specifications
- Validity Measures: Analytics data correlation and behavioral consistency checks
- Reliability Factors: Clear usage definitions and consistent measurement periods
- Bias Mitigation: Ask about typical rather than ideal usage patterns
Analysis Framework
- Statistical Methods: Usage frequency analysis, behavioral segmentation, and pattern recognition
- Interpretation Guidelines: Identify heavy, moderate, and light usage segments for targeted strategies
- Reporting Standards: Present usage data with customer lifecycle stage context
Awareness and Knowledge Questions
Awareness and knowledge questions test respondents’ familiarity with topics, concepts, or information relevant to research objectives.
Core Attributes
- Purpose: Establish baseline knowledge levels and measure educational campaign effectiveness
- Response Format: True/false statements, multiple choice knowledge tests, and awareness scales
- Data Type: Categorical knowledge levels and quantitative awareness scores
Implementation Context
- Optimal Use Cases: Educational program evaluation, public health campaigns, and training effectiveness
- Industry Applications: Healthcare, education, government communications, and professional development
- Sample Size Considerations: 250+ respondents for reliable knowledge distribution analysis
Technical Specifications
- Validity Measures: Expert review of knowledge items and criterion-related validity
- Reliability Factors: Consistent question difficulty and unambiguous correct answers
- Bias Mitigation: Randomize answer order and include “don’t know” response options
Analysis Framework
- Statistical Methods: Knowledge score distributions, pre-post comparisons, and group differences
- Interpretation Guidelines: Focus on knowledge gaps rather than overall scores for intervention planning
- Reporting Standards: Present knowledge levels with demographic breakdowns and confidence intervals
Opinion and Attitude Questions
Opinion and attitude questions measure subjective viewpoints, preferences, and emotional responses toward specific topics or concepts.
Core Attributes
- Purpose: Understand public sentiment and predict behavioral intentions based on attitudes
- Response Format: Agreement scales, semantic differentials, and opinion ranking questions
- Data Type: Qualitative attitudinal data with quantitative measurement scales
Implementation Context
- Optimal Use Cases: Political polling, social research, brand positioning, and policy development
- Industry Applications: Government, nonprofit organizations, political campaigns, and social research
- Sample Size Considerations: 400+ respondents for representative opinion measurement
Technical Specifications
- Validity Measures: Attitude-behavior correlation studies and construct validity testing
- Reliability Factors: Internal consistency across related attitude items (alpha > 0.8)
- Bias Mitigation: Balanced scale anchors and neutral question wording
Analysis Framework
- Statistical Methods: Factor analysis, attitude clustering, and opinion trend analysis
- Interpretation Guidelines: Consider attitude strength alongside direction for behavior prediction
- Reporting Standards: Report opinion distributions with margin of error and demographic breakdowns
Preference Questions
Preference questions identify respondent choices and priorities among multiple options, products, or features through comparative evaluation.
Core Attributes
- Purpose: Guide product development and marketing positioning through choice modeling
- Response Format: Ranking exercises, paired comparisons, and preference rating scales
- Data Type: Ordinal preference rankings and quantitative utility scores
Implementation Context
- Optimal Use Cases: Product feature prioritization, menu optimization, and service configuration
- Industry Applications: Consumer goods, restaurants, software development, and service design
- Sample Size Considerations: 150+ respondents per preference comparison for statistical significance
Technical Specifications
- Validity Measures: Choice consistency checks and revealed preference validation
- Reliability Factors: Transitive preference relationships and stable ranking patterns
- Bias Mitigation: Randomize option presentation order and limit comparison complexity
Analysis Framework
- Statistical Methods: Conjoint analysis, preference mapping, and choice modeling
- Interpretation Guidelines: Focus on preference strength differences rather than just rankings
- Reporting Standards: Present preference hierarchies with statistical significance indicators
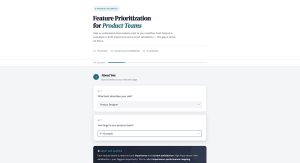
Importance Questions
Importance questions measure how much weight respondents assign to different factors, attributes, or considerations in decision-making processes.
Core Attributes
- Purpose: Identify key drivers of satisfaction and decision-making priorities
- Response Format: Importance rating scales, allocation exercises, and ranking methods
- Data Type: Quantitative importance weights and ordinal priority rankings
Implementation Context
- Optimal Use Cases: Feature prioritization, service improvement planning, and value proposition development
- Industry Applications: Product management, service design, healthcare, and B2B sales
- Sample Size Considerations: 200+ respondents for stable importance weight calculations
Technical Specifications
- Validity Measures: Importance-satisfaction correlation analysis and predictive validity testing
- Reliability Factors: Consistent importance criteria and stable weight assignments
- Bias Mitigation: Force ranking or constant sum allocation to prevent response inflation
Analysis Framework
- Statistical Methods: Derived importance analysis, key driver analysis, and regression weighting
- Interpretation Guidelines: Combine importance ratings with satisfaction scores for actionable insights
- Reporting Standards: Present importance hierarchies with performance gaps highlighted
Frequency Questions
Frequency questions measure how often specific behaviors, activities, or events occur within defined time periods.
Core Attributes
- Purpose: Quantify behavior patterns and establish usage baselines for analysis
- Response Format: Frequency scales, numerical counts, and time-based categories
- Data Type: Quantitative behavioral frequency data
Implementation Context
- Optimal Use Cases: Usage analysis, habit tracking, and market sizing research
- Industry Applications: Media consumption, retail shopping, healthcare behaviors, and digital services
- Sample Size Considerations: 300+ respondents for reliable frequency distribution analysis
Technical Specifications
- Validity Measures: Self-report validation through behavioral data correlation
- Reliability Factors: Clear time period definitions and consistent frequency categories
- Bias Mitigation: Use specific timeframes and provide frequency examples for accuracy
Analysis Framework
- Statistical Methods: Frequency distribution analysis, usage segmentation, and trend identification
- Interpretation Guidelines: Focus on meaningful frequency differences rather than exact numbers
- Reporting Standards: Present frequency data with clear time period context and sample descriptions
Screening Questions
Screening questions qualify respondents for survey participation by confirming they meet specific demographic, behavioral, or experiential criteria.
Core Attributes
- Purpose: Ensure sample quality and target audience alignment for valid research results
- Response Format: Yes/no questions, multiple choice qualifiers, and categorical selections
- Data Type: Categorical qualification data for sample composition
Implementation Context
- Optimal Use Cases: Market research qualification, customer experience studies, and product feedback collection
- Industry Applications: All research contexts requiring specific participant characteristics
- Sample Size Considerations: Over-recruit by 20-30% to account for screening failures
Technical Specifications
- Validity Measures: Qualification criteria alignment with research objectives
- Reliability Factors: Clear screening criteria and consistent application across respondents
- Bias Mitigation: Neutral screening language that doesn’t reveal desired responses
Analysis Framework
- Statistical Methods: Screening rate analysis and qualification distribution tracking
- Interpretation Guidelines: Monitor screening efficiency and adjust criteria if pass rates are too low/high
- Reporting Standards: Document screening criteria and final sample composition for transparency
Post-Event Feedback Questions
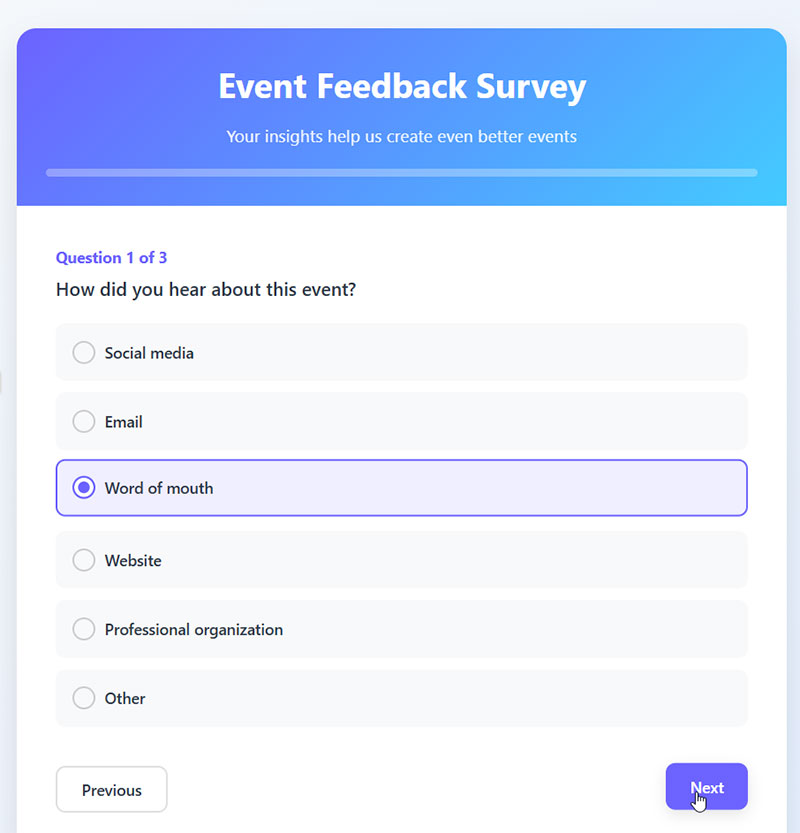
Post-event feedback questions evaluate attendee satisfaction, learning outcomes, and experience quality immediately following events or programs.
Core Attributes
- Purpose: Measure event success and identify improvement opportunities for future events
- Response Format: Satisfaction ratings, multiple choice evaluations, and open-ended feedback
- Data Type: Mixed quantitative satisfaction scores and qualitative improvement suggestions
Implementation Context
- Optimal Use Cases: Conference evaluation, training assessment, and customer event feedback
- Industry Applications: Event management, corporate training, education, and customer experience
- Sample Size Considerations: Target 50%+ response rate from event attendees for representative feedback
Technical Specifications
- Validity Measures: Event objective achievement and attendee engagement correlation
- Reliability Factors: Consistent evaluation criteria and standardized feedback timing
- Bias Mitigation: Collect feedback immediately post-event while experience is fresh
Analysis Framework
- Statistical Methods: Satisfaction scoring, content effectiveness analysis, and improvement prioritization
- Interpretation Guidelines: Weight overall satisfaction alongside specific event element ratings
- Reporting Standards: Present results with attendance context and demographic breakdowns
Employee Engagement Questions
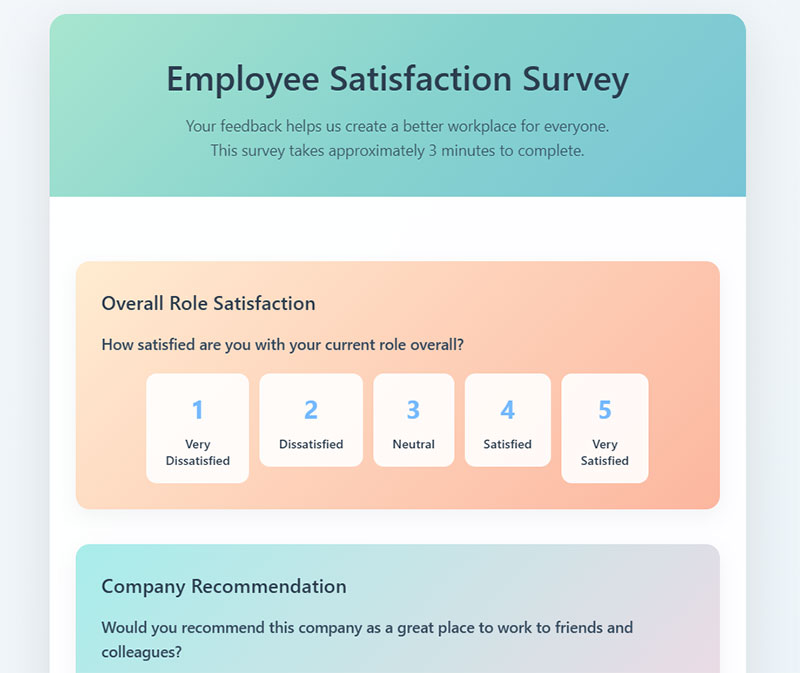
Employee engagement questions measure workforce commitment, motivation, and emotional connection to organizational goals and values.
Core Attributes
- Purpose: Assess employee satisfaction and predict retention and performance outcomes
- Response Format: Agreement scales, engagement indices, and behavioral intention questions
- Data Type: Quantitative engagement scores with qualitative context
Implementation Context
- Optimal Use Cases: Annual engagement surveys, pulse surveys, and organizational culture assessment
- Industry Applications: Human resources across all sectors and organizational sizes
- Sample Size Considerations: Target 60%+ employee participation for organizational representation
Technical Specifications
- Validity Measures: Engagement correlation with performance metrics and retention rates
- Reliability Factors: Validated engagement scales and consistent administration protocols
- Bias Mitigation: Anonymous responses and neutral question wording to encourage honesty
Analysis Framework
- Statistical Methods: Engagement index calculation, driver analysis, and longitudinal trending
- Interpretation Guidelines: Focus on engagement drivers rather than overall scores for action planning
- Reporting Standards: Present results with benchmarks and maintain confidentiality protocols
Market Research Questions
Market research questions investigate market conditions, competitive landscapes, consumer preferences, and business opportunities through systematic inquiry.
Core Attributes
- Purpose: Inform strategic business decisions through market intelligence and consumer insights
- Response Format: Mixed methodology including ratings, choices, rankings, and open responses
- Data Type: Comprehensive quantitative and qualitative market data
Implementation Context
- Optimal Use Cases: Market entry analysis, competitive positioning, and opportunity identification
- Industry Applications: Strategy consulting, product management, marketing, and business development
- Sample Size Considerations: 400+ respondents for market-level insights and segmentation analysis
Technical Specifications
- Validity Measures: Multiple data source triangulation and market reality validation
- Reliability Factors: Standardized methodology and consistent data collection protocols
- Bias Mitigation: Representative sampling and neutral question framing
Analysis Framework
- Statistical Methods: Market sizing, segmentation analysis, competitive positioning, and trend forecasting
- Interpretation Guidelines: Consider market context and competitive dynamics in result interpretation
- Reporting Standards: Present findings with methodology transparency and confidence intervals
Usability Testing Questions

Usability testing questions evaluate user experience effectiveness by measuring task completion, satisfaction, and interface interaction quality.
Core Attributes
- Purpose: Identify user experience problems and optimize interface design for user success
- Response Format: Task completion metrics, difficulty ratings, and user satisfaction scales
- Data Type: Quantitative usability metrics combined with qualitative user feedback
Implementation Context
- Optimal Use Cases: Website optimization, app development, and interface redesign validation
- Industry Applications: Software development, web design, mobile applications, and digital services
- Sample Size Considerations: 15-20 users per user group for identifying major usability issues
Technical Specifications
- Validity Measures: Task success correlation with user goals and business objectives
- Reliability Factors: Standardized task scenarios and consistent testing protocols
- Bias Mitigation: Realistic task scenarios and neutral facilitator guidance
Analysis Framework
- Statistical Methods: Task success rates, completion time analysis, and error frequency tracking
- Interpretation Guidelines: Prioritize issues affecting task completion over satisfaction ratings
- Reporting Standards: Present results with task context and user segment breakdowns
Price Sensitivity Questions
Price sensitivity questions measure consumer willingness to pay and price elasticity through systematic price point evaluation and purchase intent measurement.
Core Attributes
- Purpose: Optimize pricing strategies and understand price-demand relationships for revenue maximization
- Response Format: Price acceptance scales, purchase likelihood at different price points, and value perception ratings
- Data Type: Quantitative price response curves and qualitative value justifications
Implementation Context
- Optimal Use Cases: Pricing strategy development, product launch planning, and revenue optimization
- Industry Applications: Consumer goods, SaaS pricing, retail, and professional services
- Sample Size Considerations: 300+ respondents for reliable price sensitivity modeling
Technical Specifications
- Validity Measures: Actual purchase behavior validation and price elasticity confirmation
- Reliability Factors: Consistent price presentation and realistic purchase scenarios
- Bias Mitigation: Include budget qualification and competitive context for realistic responses
Analysis Framework
- Statistical Methods: Price sensitivity analysis, demand curve modeling, and optimal price identification
- Interpretation Guidelines: Consider price sensitivity alongside value perception for pricing decisions
- Reporting Standards: Present price recommendations with confidence intervals and market context
FAQ on Types Of Survey Questions
What’s the difference between open-ended and closed-ended questions?
Open-ended questions allow free-text responses, providing qualitative data but requiring manual analysis. Closed-ended questions offer predetermined response options like multiple choice or rating scales. They generate quantitative data that’s easier to analyze but limit respondent expression. Choose based on your analysis capacity and data needs.
When should I use multiple choice versus checkbox questions?
Use multiple choice questions when respondents should select only one answer. Choose checkbox questions for “select all that apply” scenarios where multiple responses are valid. Checkbox questions work well for preference identification and behavior tracking, while multiple choice suits demographic questions and single-preference measurements.
What are Likert scale questions best for?
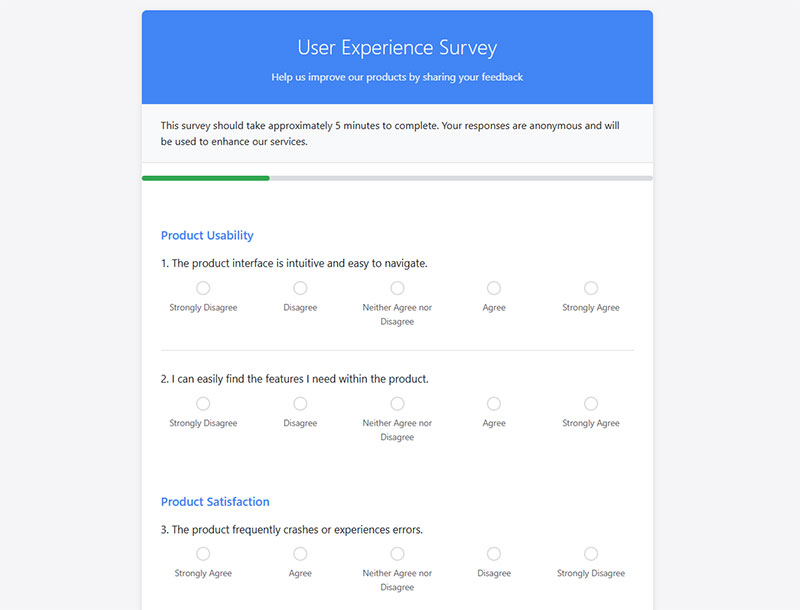
Likert scale questions measure agreement levels using 5-7 point scales from “strongly disagree” to “strongly agree.” They’re ideal for attitude measurement, opinion surveys, and customer satisfaction research. These rating scale questions provide ordinal data that’s easy to analyze statistically and compare across respondent groups.
How do dropdown questions differ from radio buttons?
Both allow single selection, but dropdown questions save screen space by hiding options until clicked. Radio buttons display all choices simultaneously. Use dropdowns for long lists like countries or products. Radio buttons work better for short lists where you want immediate option visibility.
What are ranking questions used for?
Ranking questions ask respondents to order items by preference or importance. They reveal priority hierarchies but become difficult with more than 7-8 options. These question types excel in product feature prioritization, brand preference studies, and decision-making research where relative importance matters more than absolute ratings.
When should I use semantic differential questions?
Semantic differential questions measure attitudes using opposing adjective pairs like “satisfied-dissatisfied” on rating scales. They’re superior to standard Likert scales for brand perception, product evaluation, and concept testing. These questions capture emotional attitudes across multiple dimensions, providing richer attitudinal data than traditional agreement scales.
What are matrix questions good for?
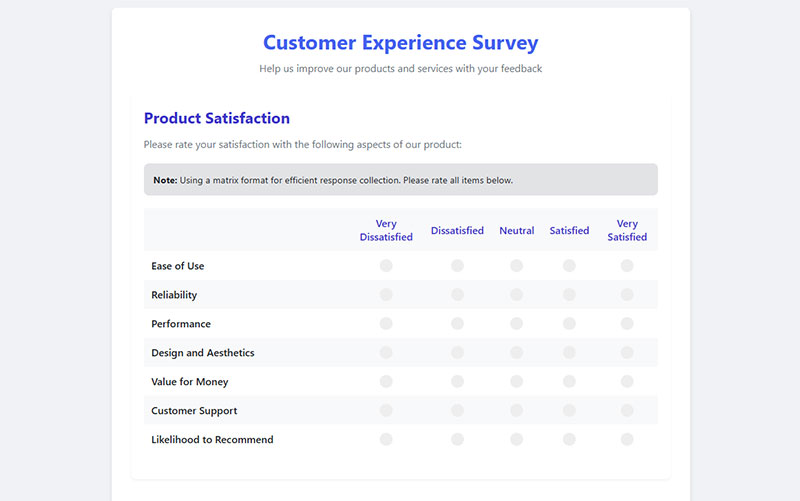
Matrix questions group related items in table format with consistent response options. They reduce survey length when measuring multiple items with identical scales. Perfect for employee satisfaction surveys, product feature ratings, or demographic questions. However, they can cause survey fatigue with too many rows.
How do constant sum questions work?
Constant sum questions require respondents to allocate points (typically 100) across multiple options, revealing relative importance through forced trade-offs. They’re excellent for budget allocation scenarios, feature prioritization, and importance weighting. These questions provide ratio-level data showing not just preference order but magnitude differences.
What’s the purpose of demographic questions?
Demographic questions collect background information like age, gender, income, and location for segmentation analysis. They enable cross-tabulation, help verify sample representativeness, and support targeted insights. Place them at survey end to avoid early abandonment, and keep categories inclusive and culturally appropriate.
When should I use conditional logic in surveys?
Conditional logic shows or hides questions based on previous responses, creating personalized survey paths. Use it to skip irrelevant questions, reduce survey fatigue, and improve data quality. Essential for complex surveys with multiple audience segments or when screening respondents for specific qualifications or experiences.
Conclusion
Mastering different types of survey questions transforms ordinary questionnaires into powerful data collection instruments. The right question format can reveal hidden customer preferences, measure employee engagement accurately, and generate actionable business insights that drive real decisions.
Your survey’s success depends on matching question types to research objectives. Use dropdown questions for efficient data entry, checkbox questions for multiple preferences, and MaxDiff analysis when prioritization matters most. Semantic differential scales capture emotional attitudes that traditional rating scales miss entirely.
Remember the fundamentals: closed-ended questions provide quantitative data for statistical analysis, while open-ended questions offer qualitative insights that numbers alone cannot capture. Matrix questions streamline lengthy surveys, but conditional logic creates personalized respondent experiences that boost completion rates.
Start experimenting with advanced question formats like constant sum scales and heat map questions. These specialized tools separate professional researchers from amateurs. Your next survey deserves better than basic multiple choice questions.
Quality questionnaire design begins with understanding when each question type delivers maximum value.