


Users expect to grab a file off their desktop and drop it straight into your browser. The standard file input button feels dated by comparison. Learning how to make a…
Table of Contents
Poor survey design kills response rates before you send a single invitation.
Learning how to create a survey form that people actually complete requires understanding question types, form logic, and distribution strategies. Most surveys fail because they’re too long, confusing, or technically broken.
This guide covers survey planning, question writing, form design, testing methods, and analysis techniques. You’ll learn which survey platforms fit different needs and how to avoid the mistakes that tank completion rates.
Build surveys that generate useful data instead of getting ignored.
How To Create A Survey Form: Quick Workflow
-
Choose a survey tool or platform such as Google Forms, Microsoft Forms, SurveyMonkey, Jotform, or Canva.
-
Start a new survey by creating a form and giving it a title and description.
-
Add questions by selecting the question types needed (e.g., multiple choice, text response, rating scales, date, Likert scales).
-
Customize the survey by arranging questions, applying conditional logic (show/hide questions based on responses), and designing the look to match your brand or style.
-
Set up notifications or autoresponders if needed to manage responses.
-
Preview and test the survey to ensure everything works correctly.
-
Publish the survey and share it via links, email, social media, or embedding on a website.
-
Collect and analyze responses with built-in tools or export the data for further analysis.
Types of Survey Forms (the most popular ones)
| Survey Type | Primary Purpose | Target Audience | Key Metrics Measured |
|---|---|---|---|
| Customer Satisfaction Survey | Measure overall customer contentment with products/services | Existing customers | CSAT score, service quality, product satisfaction |
| Employee Satisfaction Survey | Assess workplace engagement and organizational culture | Internal employees | Job satisfaction, engagement levels, retention factors |
| Market Research Survey | Gather intelligence on market trends and consumer behavior | Target market segments | Market size, demographics, purchasing patterns, preferences |
| Product Feedback Survey | Collect specific insights on product features and usability | Product users | Feature effectiveness, usability, improvement suggestions |
| Event Feedback Survey | Evaluate event execution and attendee experience quality | Event attendees | Venue quality, content relevance, logistics, speaker ratings |
| Website Feedback Survey | Optimize digital user experience and site performance | Website visitors | Navigation ease, page speed, content clarity, design appeal |
| Net Promoter Score (NPS) Survey | Quantify customer loyalty and recommendation likelihood | Existing customers | Promoters, passives, detractors, loyalty index |
| Post-Purchase Survey | Capture immediate transaction experience and fulfillment | Recent buyers | Checkout process, delivery experience, initial satisfaction |
Online survey forms run through web browsers and email platforms. They’re cheap to distribute and analyze automatically.
Paper-based survey forms work for offline environments like conferences or clinics. Scanning converts them to digital data later.
Mobile survey forms capture responses through smartphone apps. Location data and photo uploads add context to answers.
Email survey forms embed questions directly in messages or link to external platforms. Response rates drop when people have to click through.
Embedded survey forms sit inside web pages and collect visitor feedback without redirecting. They reduce friction and improve conversion rates.
Kiosk survey forms appear on tablets or touchscreens in physical locations. Retail stores and airports use them for instant customer feedback.
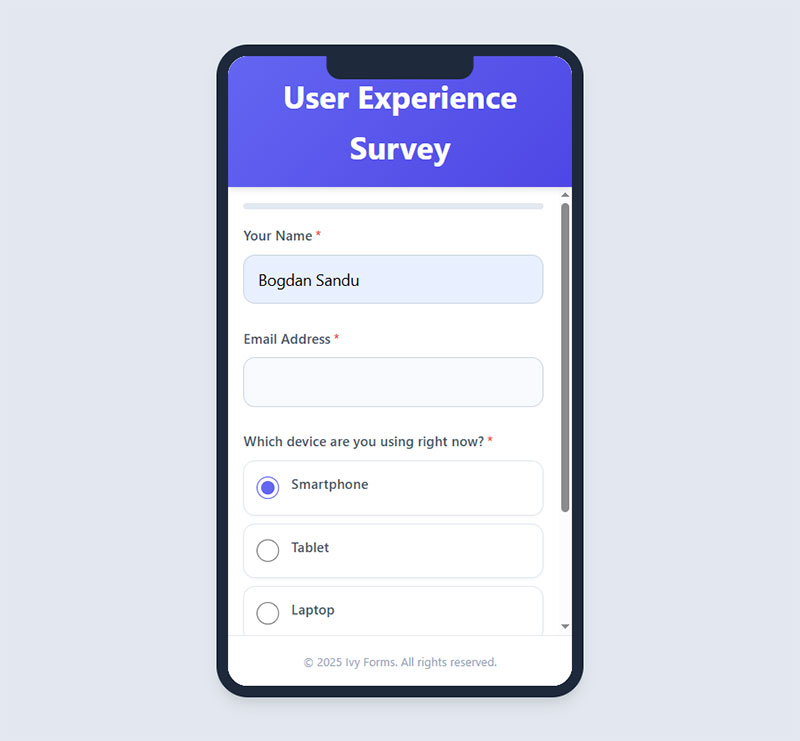
Components of a Survey Form
Form header and introduction
Survey titles tell respondents what to expect. Purpose statements explain why their input matters.
Estimated completion time prevents abandonment. Privacy notices build trust by explaining data usage.
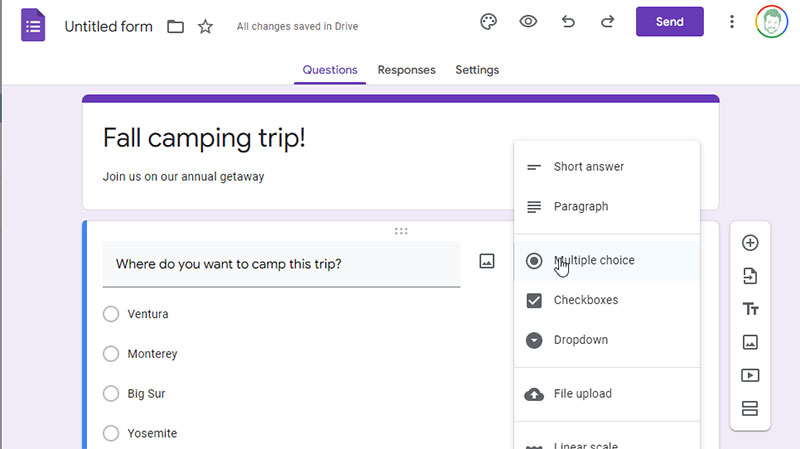
Question types
Multiple choice questions offer predetermined answers. Radio buttons force single selections while checkboxes allow multiple picks.
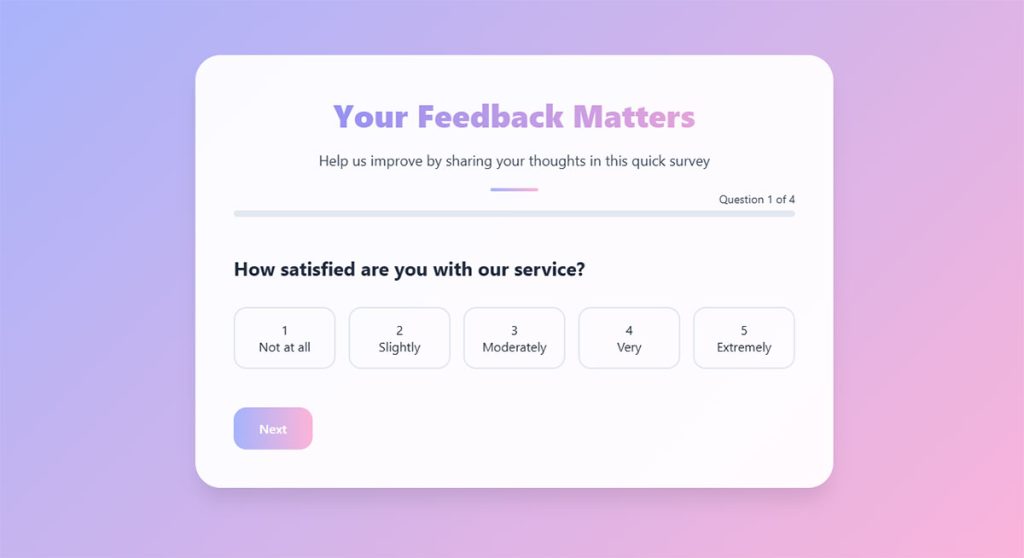
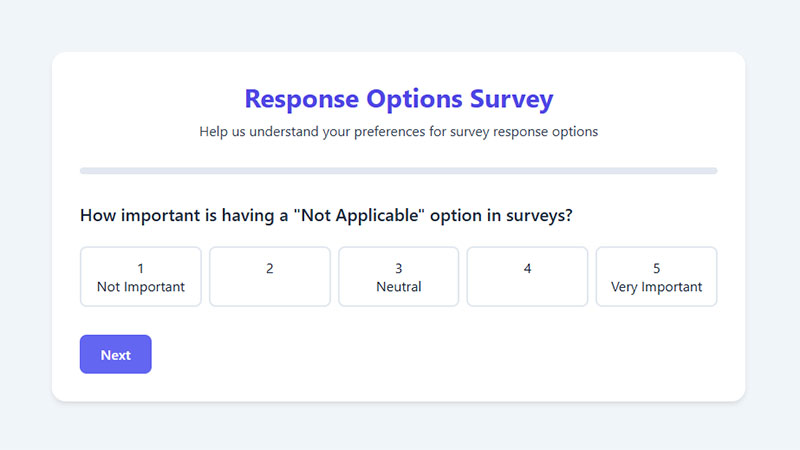
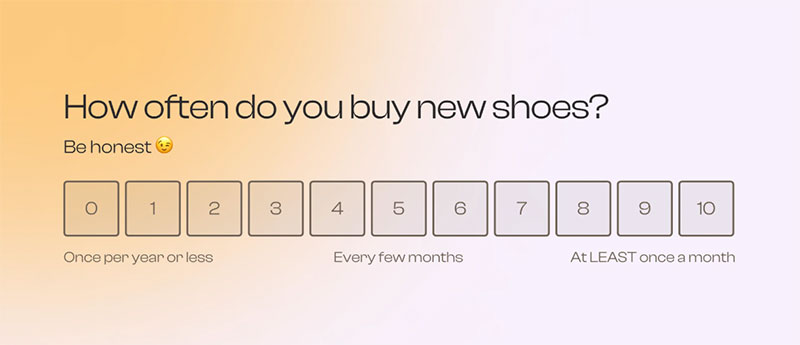
Rating scale questions measure intensity of opinions. Likert scales run from “strongly disagree” to “strongly agree” across five or seven points.
Open-ended questions capture detailed explanations. Text areas let respondents write freely without answer constraints.
Dropdown questions save space by hiding options until clicked. Matrix questions group related items into rows and columns for faster completion.
Ranking questions force priority decisions. Slider controls offer visual ways to indicate preferences across ranges.
Form structure elements
Progress indicators show completion percentage. Page breaks split long surveys into digestible chunks.
Skip logic patterns route respondents based on previous answers. Conditional questions appear only when relevant criteria are met.
Form footer
Submit buttons trigger form processing. Thank you messages confirm successful submission and set expectations.
Next steps information tells respondents what happens with their data or when they’ll hear results.
Planning Your Survey Form
Define survey objectives
Identify specific information gaps your survey will fill. Vague goals produce useless data.
Set measurable targets like “improve product satisfaction score by 15%” or “identify top three feature requests.” Target audience definition determines question complexity and distribution channels.
Research existing surveys
Review competitor questionnaires to spot question patterns. Analyze similar feedback forms for structure ideas.
Study question formats that generated high response rates. Examine how others handle sensitive topics or demographic data collection.
Create question outline
List every piece of information you actually need. Group related questions into logical sections like demographics, usage patterns, and satisfaction ratings.
Order questions from general to specific. Remove redundant items that ask the same thing differently.
Select survey platform
Google Forms handles basic surveys for free with automatic data collection to Google Sheets. Limited customization but dead simple to set up.
Microsoft Forms integrates with Office 365 accounts and offers branching logic. Real-time response charts update automatically.
Typeform creates conversational interfaces with one question per screen. Higher completion rates but paid plans get expensive.
SurveyMonkey provides professional features like question randomization and A/B testing. Advanced analytics require premium subscriptions.
Jotform supports payment collection and file uploads within surveys. Over 10,000 templates speed up creation.
Custom HTML forms offer complete control over design and functionality. Requires coding knowledge and separate database setup.
Writing Survey Questions
Question writing principles
Clear language eliminates confusion. “How often do you exercise?” beats “What is your typical physical activity frequency pattern?”
Leading questions bias results. “Don’t you agree our service is excellent?” pushes respondents toward positive answers.
Double-barreled questions ask two things at once. “Is our product affordable and easy to use?” can’t be answered accurately if one is true and one isn’t.
Focused questions target single concepts. Neutral wording avoids emotional triggers that skew responses.
Demographic questions
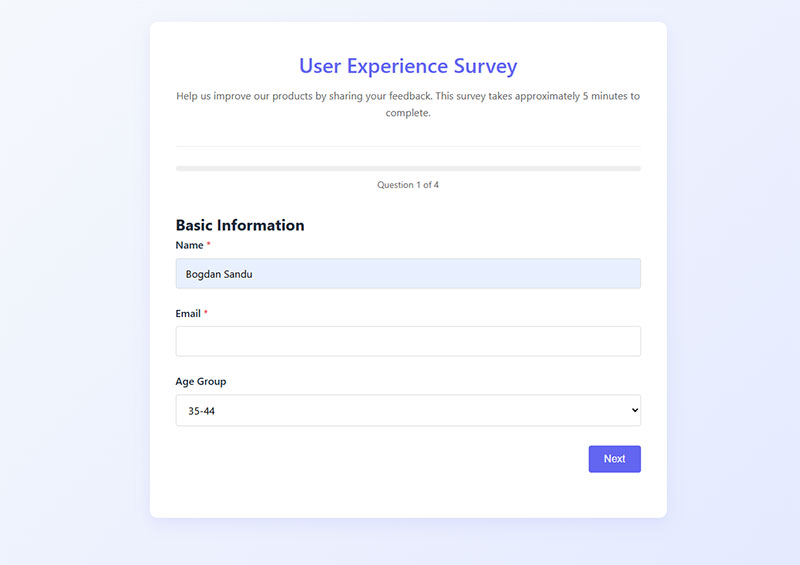
Age range questions use brackets like 18-24, 25-34, 35-44 instead of exact numbers. People share ranges more willingly than specific ages.
Gender identification options include male, female, non-binary, and prefer not to say. Location data ranges from country level to zip codes depending on analysis needs.
Income brackets follow census categories for benchmark comparisons. Education level questions span from high school to advanced degrees.
Behavioral questions
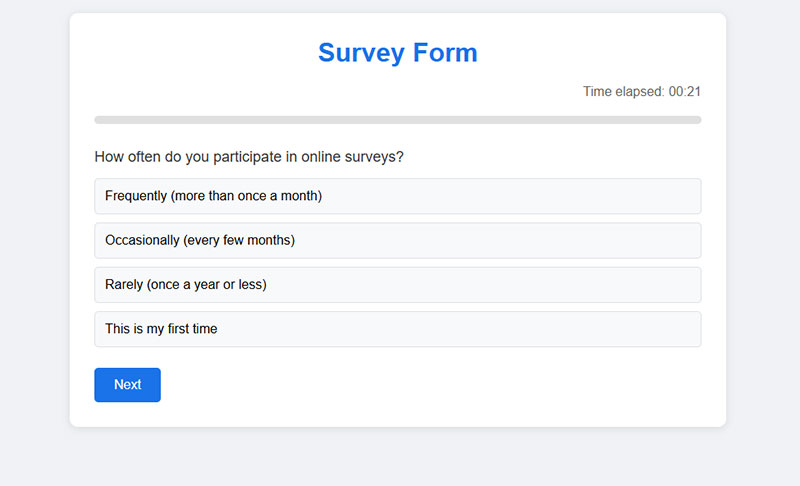
Frequency questions measure how often actions occur. “Never,” “rarely,” “sometimes,” “often,” and “always” capture usage patterns.
Purchase patterns reveal buying triggers and decision timelines. Usage habits show which features matter most to active users.
Decision factors rank what influences choices. Price sensitivity, brand loyalty, and peer recommendations emerge from these questions.
Attitudinal questions
Satisfaction ratings use numeric scales or star systems. Net Promoter Score asks “How likely are you to recommend us?” on a 0-10 scale.
Preference indicators compare multiple options side by side. Opinion scales measure agreement intensity across statements.
Sentiment measures capture emotional responses to products or services. Positive, neutral, and negative classifications simplify analysis.
Designing the Survey Form
Visual design elements
Color schemes guide attention and reinforce branding. Contrasting colors highlight submit buttons and required fields.
Font choices affect readability across devices. Sans-serif fonts like Arial or Helvetica work better on screens than serif options.
White space prevents visual overwhelm. Button styling needs clear hover states and sufficient size for mobile taps.
Layout considerations
Single-column layouts work best for mobile devices. Question spacing creates breathing room between sections.
Answer field sizing matches expected response length. Navigation placement at bottom-right feels natural for most users.
Accessibility features
Screen reader compatibility requires proper HTML labels and ARIA attributes. Keyboard navigation lets users tab through all form fields without a mouse.
Color contrast ratios must meet WCAG 2.1 standards of 4.5:1 for normal text. Alt text describes images and icons for visually impaired users.
Error message clarity explains what went wrong and how to fix it. Understanding form accessibility best practices ensures everyone can complete your survey.
Setting Up Form Logic
Conditional branching
If/then question paths show relevant questions based on previous answers. Skip patterns hide irrelevant sections automatically.
Display rules reveal fields only when specific conditions are met. Response-based routing directs users through personalized question flows.
Validation rules
Required fields prevent incomplete submissions. Format requirements ensure email addresses include @ symbols and phone numbers contain proper digit counts.
Range limitations keep numeric answers within acceptable bounds. Character limits control text field length and prevent database overflow.
Calculation fields
Score totals add up numeric responses automatically. Weighted responses apply different values to answer choices.
Computed values perform math on user inputs without manual calculation. Once created, you can easily embed survey forms on your website or landing pages.
Testing Your Survey Form
Pre-launch testing
Test every question type on desktop and mobile browsers. Check conditional logic triggers correctly based on answers.
Verify mobile display adapts to smaller screens. Review completion time matches your estimate.
Test submission process confirms data reaches your database or email.
Pilot testing
Select a small test group representing your target audience. Collect feedback on confusing questions or technical issues.
Identify questions where respondents hesitate or abandon. Measure actual completion rates against your goals.
Refine wording and order based on real user behavior.
Distributing Your Survey Form
Distribution channels
Email campaigns reach existing contacts directly. Social media posts expand audience beyond your current list.
Website embedding places surveys where visitors already browse. QR codes bridge physical and digital touchpoints.
SMS messages deliver surveys to mobile phones instantly.
Distribution strategy
Schedule timing around when your audience is most responsive. Target audience segmentation sends relevant surveys to specific groups.
Follow-up reminders boost completion rates by 20-30%. Incentive offerings like gift cards or discounts increase participation.
Collecting Survey Responses
Response tracking
Monitor completion rates to spot technical problems early. Track drop-off points revealing where users abandon surveys.
Review partial submissions for patterns in incomplete data. Analyze response times identifying questions that take too long.
Data quality control
Filter duplicate responses using email addresses or IP tracking. Remove test entries before final analysis.
Validate response patterns catching straight-lining where users select the same answer repeatedly. Check for spam submissions containing gibberish or promotional content.
Analyzing Survey Results
Data organization
Export response data to CSV or Excel files. Clean data entries by removing incomplete or invalid responses.
Categorize open-ended answers into themes and topics. Create data tables organizing responses by demographic segments.
Statistical analysis
Calculate averages for numeric rating questions. Determine percentages showing how many chose each answer option.
Identify trends comparing responses across time periods. Compare segments revealing differences between demographic groups.
Visualization methods
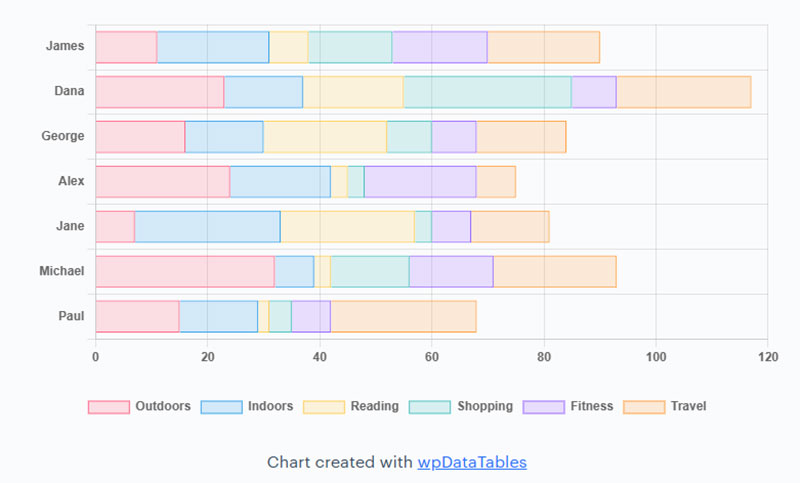
Bar charts compare response frequencies across answer choices. Pie charts show percentage breakdown of categorical data.
Line graphs track changes over multiple survey periods. Heat maps reveal patterns in matrix questions.
Word clouds highlight frequently mentioned terms in open-ended responses.
Survey Form Best Practices
Length optimization
Limit surveys to 10 questions or less for casual feedback. Balance depth with brevity to respect respondent time.
Remove questions that don’t directly support your objectives. Group similar topics into logical sections.
Response rate improvement
Write compelling introductions explaining why feedback matters. Offer incentives proportional to survey length and effort.
Send reminders 3-5 days after initial invitation. Optimize timing by avoiding Mondays and Friday afternoons.
Mobile optimization
Test on iOS and Android devices before launch. Simplify navigation with clear next/previous buttons.
Use large touch targets of at least 44×44 pixels. Minimize scrolling by breaking long surveys into multiple pages.
Privacy compliance
GDPR requirements mandate explicit consent for data collection and processing. Respondents must access, correct, or delete their data upon request.
CCPA regulations require disclosure of what data you collect and how you use it. Data storage policies should specify retention periods and security measures.
Consent mechanisms need clear opt-in checkboxes, not pre-checked boxes.
Common Survey Form Mistakes
Question design errors
Biased wording pushes respondents toward specific answers. Complex language confuses people with jargon or technical terms.
Too many answer options overwhelm decision-making. Ambiguous scales lack clear definitions between rating points.
Technical issues
Broken links prevent survey access entirely. Missing required indicators leave respondents guessing which fields are mandatory.
Poor mobile experience forces pinching and zooming. Slow loading times increase abandonment before completion.
Distribution problems
Wrong audience targeting wastes responses on people who can’t provide valuable insights. Poor timing catches people during holidays or busy periods.
Insufficient promotion limits response volume. Missing incentives reduce motivation to participate.
Survey Form Tools Comparison
Google Forms
Free tier includes unlimited questions and responses. Integration options connect to Google Sheets for automatic data transfer.
Template library offers pre-built survey structures. Limitations include basic design customization and no payment collection.
Typeform
Interactive design presents one question at a time for conversational flow. Conversational interfaces increase completion rates by 15-20%.
Pricing structure starts at $25/month for basic features. Advanced features include logic jumps, hidden fields, and custom thank you screens.
SurveyMonkey
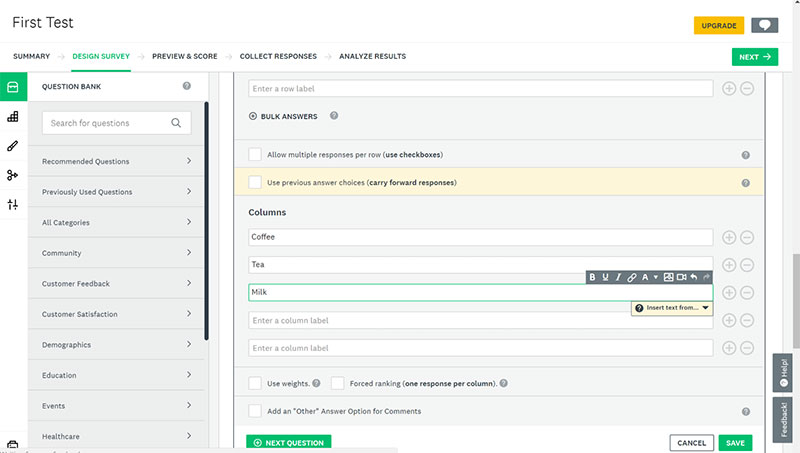
Professional capabilities include question randomization and quota management. Analysis tools provide cross-tabulation and text analysis.
Team collaboration features allow multiple editors. Enterprise features add custom branding and API access.
Microsoft Forms
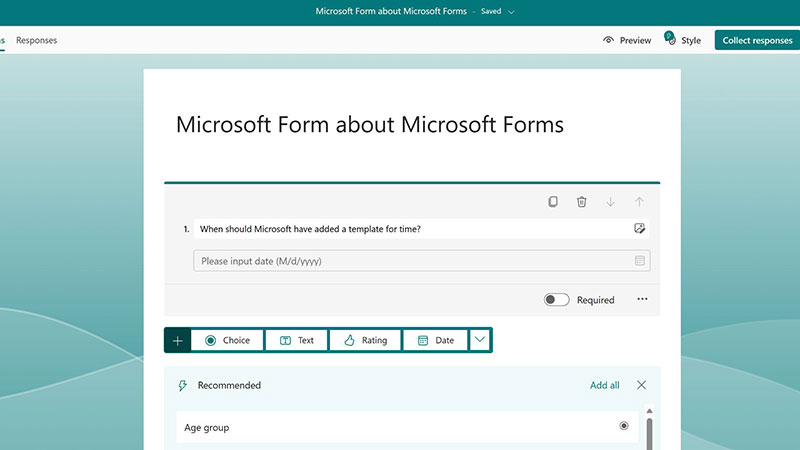
Office 365 integration pulls respondent data from organizational directories. Branching logic routes questions based on previous answers.
Template options cover employee surveys and customer feedback. Business features include real-time response charts and Excel export.
Improving Survey Response Quality
Engagement techniques
Personalization strategies insert respondent names and reference previous interactions. Progress indicators show how much remains to completion.
Interactive elements like sliders and drag-and-drop ranking maintain interest. Gamification features award points or badges for completing sections.
Question order optimization
Start with easy, non-threatening questions building confidence. Place sensitive questions about income or health after trust is established.
End with demographics since abandonment here loses less valuable data. Maintain logical flow so each question naturally leads to the next.
FAQ on How To Create A Survey Form
How long should a survey form be?
Keep surveys under 10 questions for casual feedback, 15-20 for detailed research. Completion rates drop 20% for every additional 5 minutes of survey time. Balance information needs against respondent patience.
What are the best survey question types to use?
Multiple choice questions work for predefined options. Rating scales measure satisfaction intensity. Open-ended questions capture detailed feedback. Mix question types based on whether you need quantifiable data or qualitative insights.
How do I prevent survey fatigue?
Limit total questions, use progress indicators, break long surveys into pages. Vary question formats to maintain engagement. Avoid repetitive questions asking the same thing differently, which frustrates respondents.
What’s the ideal survey response rate?
Email surveys average 20-30% response rates. Embedded website surveys hit 10-15%. Employee surveys reach 30-40%. Response rates depend on audience relationship, survey length, incentives offered, and distribution timing.
Should I use skip logic in my survey?
Yes. Conditional logic shows relevant questions based on previous answers. Skip patterns reduce survey length by hiding irrelevant sections. This improves completion rates by personalizing the experience.
How do I make my survey mobile-friendly?
Use single-column layouts, large touch targets (44×44 pixels minimum), and readable font sizes. Test on iOS and Android devices. Break long surveys into multiple pages to minimize scrolling.
What survey platforms should I use?
Google Forms works for basic surveys. Typeform creates conversational interfaces. SurveyMonkey offers professional features. Microsoft Forms integrates with Office 365. Choose based on budget, design needs, and analysis requirements.
How do I analyze survey data effectively?
Export responses to spreadsheet software. Calculate averages for numeric questions, percentages for multiple choice. Categorize open-ended responses into themes. Create visualizations like bar charts and pie charts for presentations.
What makes people abandon surveys?
Technical issues, unclear questions, excessive length, poor mobile experience. Surveys lose 10-20% of respondents at each page break. Required questions on sensitive topics trigger abandonment. Slow loading times kill participation.
How do I improve survey completion rates?
Write compelling introductions explaining why feedback matters. Offer incentives proportional to effort required. Send reminder emails 3-5 days after initial invitation. Optimize timing and keep surveys under 5 minutes.
Conclusion
Knowing how to create a survey form transforms raw questions into actionable insights. The difference between ignored surveys and completed ones comes down to thoughtful planning, clear question writing, and strategic distribution.
Focus on mobile optimization since 60% of responses come from smartphones. Test your survey logic before launch to catch technical issues that kill completion rates.
Choose the right survey platform for your budget and feature needs. Google Forms handles basic feedback while SurveyMonkey and Typeform offer advanced branching and analytics.
Keep surveys short, questions clear, and incentives aligned with effort required. Analyze response data systematically using statistical methods and visualization tools to extract meaningful patterns from participant feedback.

